Selection guide · comparison & calculator
How to choose a photodetector
Match wavelength, sensitivity and bandwidth, then complete the detector–amplifier–readout chain.
Start with the light that reaches the detector
Specify wavelength, useful signal power, background, beam size and how quickly the signal changes. Use power after collection losses and filters. A source’s output power alone does not tell you the detector signal.
Choose the measurement format first. A photodiode measures one collected channel; a spectrograph array records many wavelengths at once; a camera preserves a spatial image. For those other formats, see spectrograph selection (opens in a new tab) and scientific cameras (opens in a new tab).
- Wavelength: compare responsivity in A/W at your wavelength, rather than using the peak value elsewhere in the spectrum.
- Speed: distinguish signal bandwidth from sampling rate, timing jitter and optical bandwidth. A slow acquisition system cannot preserve a fast receiver’s output.
- Input geometry: match active area, focused spot, fibre type and connector. More collection area may increase capacitance and complicate a fast, low-noise readout.
Compare detection approaches
Silicon and InGaAs describe detector materials; APD describes multiplication; balanced describes a two-channel architecture. These choices can overlap. The examples below show catalogue configurations, not a universal ranking of sensitivity.
| Approach | Choose it for | Check before choosing | Our catalogue examples |
|---|---|---|---|
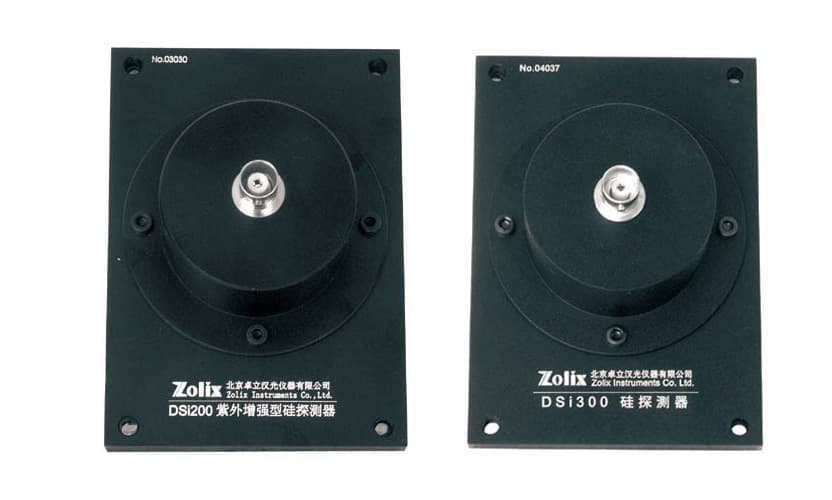
| Silicon photodiode | UV–visible light levels and scanning spectroscopy. | Check responsivity at the working wavelength and the gain–bandwidth tradeoff of the readout. | DSi200 / DSi300 DSi200: 200–1100 nm; DSi300: 350–1100 nm. Both have current output. |
| InGaAs photodiode | Near-infrared signals beyond the useful silicon response. | Extended wavelength coverage changes dark current and noise; compare the exact model. | DInGaAs1700-R03M / DInGaAs2600-R03M 1700-R03M: 800–1700 nm; 2600-R03M: 800–2600 nm. Both have current output. |
| Linear-mode APD module | Signals where internal gain can help overcome downstream electronic noise. | Avalanche multiplication adds excess noise. Confirm gain, bias, temperature compensation and linear range. | Avalanche photodetector modules 400–1000 nm or 1000–1650 nm spectral options; response-frequency options of 200 MHz, 500 MHz or 1 GHz. |
| Photomultiplier (PMT) | Weak UV–visible fluorescence and scanned emission measurements. | Select the tube, high-voltage supply and readout mode together; protect against excessive light. | PMTH photomultiplier heads PMTH tube options cover 185–900 nm across the family; each tube has its own response range. |
| Balanced receiver | A signal and reference pair carrying unwanted common intensity fluctuations. | Match both paths and check rejection versus frequency. Subtraction does not remove independent shot noise. | Balanced photodetectors up to 2.5 GHz 400–1100 nm or 850–1700 nm spectral options; bandwidth up to 2.5 GHz, configuration dependent. |
| Single-photon detector | Photon counts, coincidences and arrival-time measurements. | Compare detection efficiency, dark counts, dead time, afterpulsing and timing jitter, rather than analog gain alone. | Free-running InGaAs single-photon detector Free-running InGaAs/InP APD family for NIR detection; optional TDC. Confirm numerical performance for the selected build. |
Series ranges and maximum bandwidths do not imply that every wavelength, gain and speed can be combined. Confirm one ordered configuration. For analog detection, a linear-mode APD and a Geiger-mode single-photon APD require different readout and noise models.
Estimate signal, noise and headroom together
Narrowing the electrical noise bandwidth reduces integrated white noise, provided it still passes the signal. Compare noise-equivalent power (NEP) at the same wavelength, gain and measurement conditions. More amplifier gain increases voltage; it does not by itself improve the input signal-to-noise ratio.
Signal & noise calculator
What reaches the readout?
Estimate a DC signal, RMS noise and output headroom for a linear photodiode receiver without internal multiplication.
Every preset is an illustrative set of numbers, not the performance of any detector, source or instrument.
Useful DC optical power after optical losses.
At the same effective responsivity as the signal.
Electrical noise bandwidth, not optical bandpass or sampling rate.
Include detector dark noise and amplifier noise; exclude light-induced shot noise.
Output gain and headroom
1 MΩ = 10⁶ V/A. Use the gain of the complete receiver.
The smaller of receiver output swing and acquisition input range, allowing for offsets.
Use the receiver NEP at the selected wavelength, gain, temperature and frequency. A detector-only NEP omits added readout noise. Update NEP and bandwidth if you change receiver gain.
Calculated estimate
- Signal photocurrent
- 5 nA
- Signal output
- 5 mV
- Before clipping
- Total RMS noise
- 79.1 pA
- 0.0791 mV at output
- Signal / RMS noise
- 63.2
- DC amplitude ratio
Dark receiver floor: 158 pW RMS of input-equivalent noise over this bandwidth. Light-induced shot noise is added separately.
Share of noise variance
Output headroom check: Signal + background would produce 0.005 V against your 5 V limit (0.1%). Check detector optical linearity separately.
Equations and limits of this estimate
With optical powers Pₛ and Pᵦ in watts, responsivity R in A/W, one-sided dark receiver NEP N in W/√Hz, noise bandwidth B in Hz, and transimpedance G in V/A:
- Iₛ = R Pₛ; Iₜ = R (Pₛ + Pᵦ)
- i_dark = R N √B; i_shot = √(2 q Iₜ B)
- i_rms = √(i_dark² + i_shot²); SNR = Iₛ / i_rms
- Vₛ = G Iₛ; V_total = G Iₜ; v_rms = G i_rms
q = 1.602176634 × 10⁻¹⁹ C. Dark current shot noise is already included in the dark NEP and is not added twice. The background uses the signal responsivity; broadband light needs a spectrally weighted photocurrent instead.
This white-noise, unity-gain model assumes steady light with Poisson shot noise and a flat transimpedance over the noise band. It excludes laser intensity noise, drift, 1/f noise, frequency-dependent noise gain, APD/PMT multiplication noise, photon-counting effects and balanced-receiver subtraction. It does not predict detector saturation, receiver bandwidth, pulse peaks or ADC quantisation. Output values beyond your headroom are unclipped mathematical estimates.
Try the bright-background example. Subtracting a background level later does not undo its shot noise or recover amplifier headroom. Reject unwanted light optically where possible. For modulated measurements, select an appropriate reference frequency, lock-in filter and settling time; its equivalent noise bandwidth is not simply the modulation frequency.
Complete the chain for your experiment
Scanning spectroscopy: a DSi or DInGaAs head supplies current. Add a compatible ZAMP-A / ZAMP-B when feeding a voltage-input instrument. The DCS300PA already includes preamplification for the documented DSi configuration; do not automatically add another amplifier. Confirm detector capacitance, current range and gain-dependent bandwidth.
Weak fluorescence: compare a suitable PMTH tube with a photodiode at the emission wavelength and collection geometry. Select the PMT high-voltage supply and analog or counting readout together. For a modulated analog signal, consider the DCS500PA lock-in amplifier with a compatible input and reference; it is not a photon time tagger.
Fast optical monitoring: our low-noise PIN photoreceiver family has silicon and InGaAs variants with amplification. Match the chosen bandwidth and coupling mode to the signal, output termination and digitiser. Do not add an external transimpedance stage to an already amplified voltage output.
Differential measurements: use a balanced receiver when both optical inputs carry a common fluctuation you want to reject. Check each input’s optical limit, path matching and rejection at the measurement frequency, even when the difference output is close to zero.
Position sensing: a quadrant detector retains beam-position information that a single-area diode discards. Our 250 kHz QPD amplifier board provides analog sum and difference outputs; digitisation is separate. Use its signal-chain application note (opens in a new tab) to plan the readout.
For arrival times and coincidences, pair a suitable photon detector’s logic output with compatible photon-timing electronics (opens in a new tab). Confirm pulse polarity, thresholds and rates. An analog APD module is not automatically a photon-counting module.
A detection system designed around your experiment
We have experience designing detection systems for specific experimental needs. We can help define the detector, amplification and acquisition chain around what you need to measure.
Send your wavelength, expected signal and background, required bandwidth or time resolution, optical interface and existing equipment. We’ll help select a compatible configuration and clarify what is included and what is needed separately.
Discuss your detection system →Technology references and sources
For operating principles: PIN photodiodes (opens in a new tab), InGaAs detectors (opens in a new tab), APDs (opens in a new tab), PMTs (opens in a new tab), balanced detection (opens in a new tab) and transimpedance amplifiers (opens in a new tab).
- Model-specific detector specifications: the linked catalogue product pages and their technical documents. Receiver series sheets: PIN, APD, balanced and single-photon.
- Readout specifications: ZAMP, DCS300PA and DCS500PA.
- G. P. Eppeldauer, Noise-Optimized Silicon Radiometers, NIST Journal of Research 105 (2000): 209–219. Photocurrent noise and gain-dependent response.
- Texas Instruments, Compensate Transimpedance Amplifiers Intuitively, SBOA055A. Detector capacitance, stability and bandwidth.