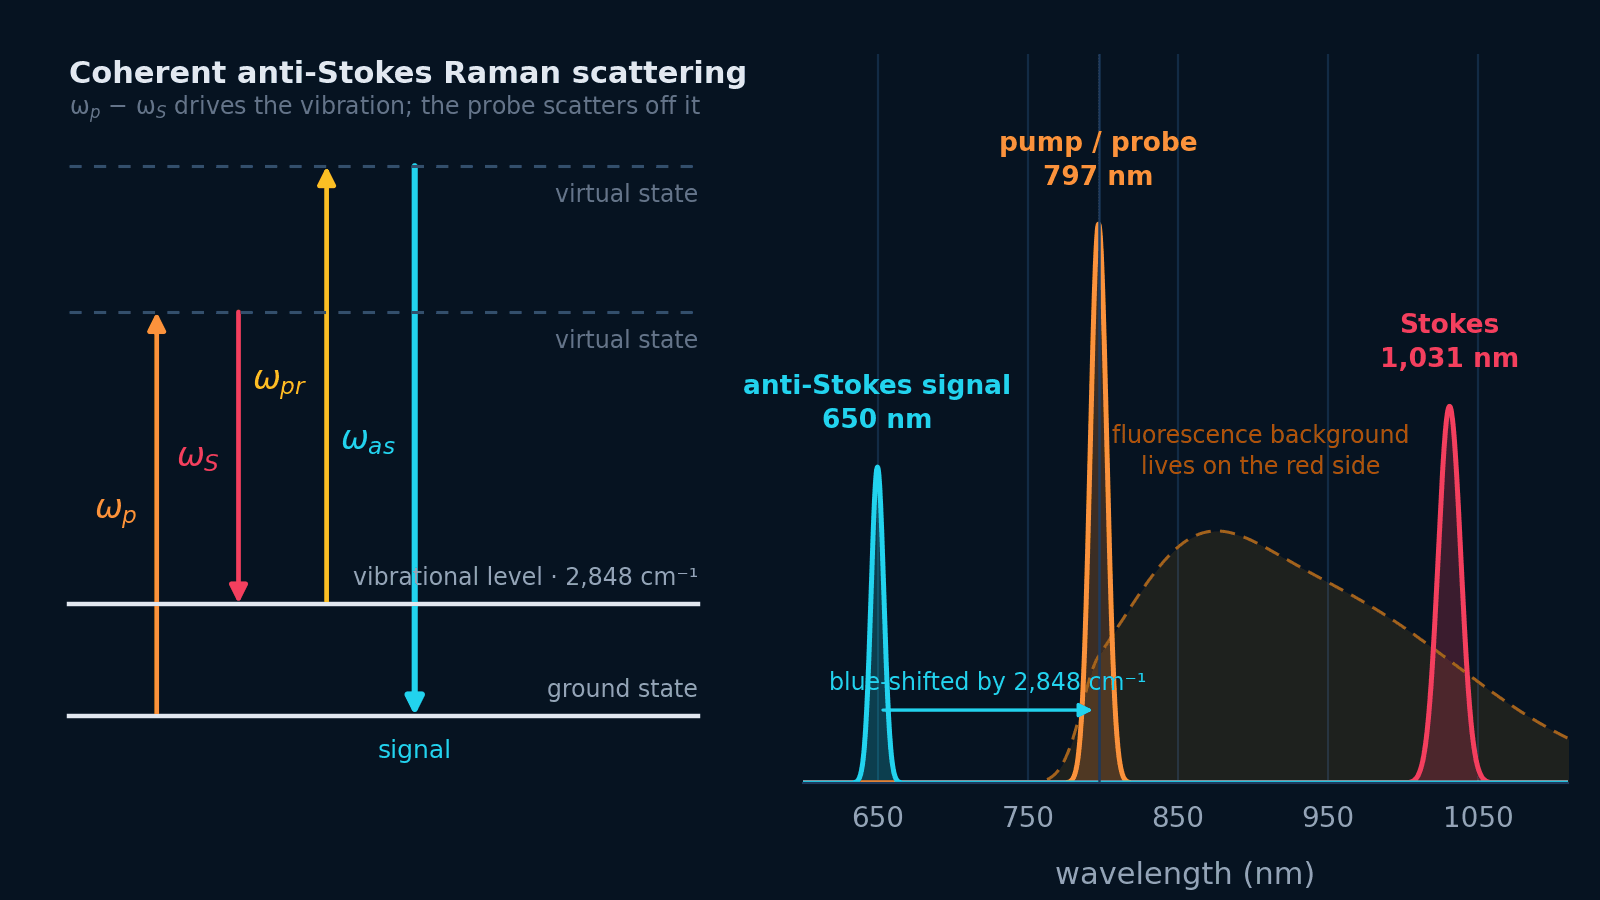
Complete system guide
Building a CARS microscope
Coherent anti-Stokes Raman scattering turns a molecule’s own bonds into contrast. Design the two colours, the delay, the filters, and the detector as one instrument — and know what the background is doing.
Two colours make the contrast
The frequency difference between pump and Stokes selects the chemical bond. Nothing is added to the sample.
Coherence makes it fast
Driven vibrations radiate in phase, so a CARS image can be acquired orders of magnitude faster than a spontaneous Raman map.
The signal lands where fluorescence cannot
A blue-shifted anti-Stokes photon is separable by filtering — but not from the non-resonant four-wave-mixing background.
The decision in one sentence
Pick the vibration first; the pulse width follows from its linewidth.
Almost every hard choice in a CARS system — laser architecture, synchronization, delay hardware, detector — is downstream of two numbers: the Raman shift you need and how wide that band is. A 2 ps pulse and a 100 fs pulse differ by a factor of twenty in bandwidth, and only one of them matches a molecular vibration.
Name the bond
CH₂ at 2 845 cm⁻¹, C≡D at 2 100 cm⁻¹, amide I near 1 655 cm⁻¹, or an unknown fingerprint region.
Bound the spectrum
One fixed band, a few hundred wavenumbers of hyperspectral range, or a whole fingerprint per pixel.
Set the dose
Power at the sample, repetition rate, dwell time, and what the specimen survives for the length of a scan.
1 · How the signal forms
Drive the vibration, then scatter off it.
Two colours, one difference
The pump and Stokes beams are focused together. Only when ω_p − ω_S matches a vibrational frequency do the molecules in the focus start oscillating in phase.
A driven, coherent ensemble
Unlike spontaneous Raman, the vibrations are not independent. They are phase-locked to the driving field, which is where the signal gain comes from.
A third field scatters
The probe field — usually the pump beam again — scatters off that coherence and generates a new field at 2ω_p − ω_S.
Signal builds coherently
Because the emitters radiate in phase, intensity scales with the square of the number of oscillators and emerges as a directional, laser-like beam.
Blue of the pump
The anti-Stokes photon has more energy than any of the input photons, so it lands where fluorescence cannot reach.
Non-resonant background rides along
Electrons respond to the same fields instantly and produce four-wave mixing whether or not a vibration is resonant. That term never goes away.
The anti-Stokes frequency
Because the detected quantity is |χ⁽³⁾|², the resonant and non-resonant terms interfere in amplitude. That interference — not noise — is what makes CARS peaks look shifted and asymmetric compared with a spontaneous Raman spectrum of the same molecule.
A CARS spectrum is not a Raman spectrum.
Peak positions can appear shifted by several wavenumbers, weak bands can invert into dips, and concentration dependence is not linear at low concentration because the resonant term interferes with the background. If the result has to be compared with a Raman library, plan the phase-retrieval step at design time — it constrains whether you need a spectrum at every pixel.
2 · Excitation schemes
Three ways to make the difference frequency, three different instruments.
The scheme decides how you change the Raman shift — by tuning a laser, by moving a stage, or not at all because every shift is recorded at once.
Narrowband picosecond
- Sources
- Two synchronized ps beams — typically one laser plus an OPO
- Resolution
- ≈ 5–15 cm⁻¹, set by the pulse bandwidths
- Best for
- Fast single-band imaging: lipids at 2 845 cm⁻¹, deuterium labels, protein amide
Tradeoff: The cleanest spectral selectivity and the best signal-to-background per milliwatt, but changing the Raman shift means tuning a laser.
Spectral focusing
- Sources
- One femtosecond source, both arms chirped by matched glass or gratings
- Resolution
- ≈ 7–25 cm⁻¹, set by the chirped duration and how well the two chirps match
- Best for
- Hyperspectral imaging over a few hundred wavenumbers without retuning
Tradeoff: A delay stage replaces wavelength tuning, so the stage step, repeatability and chirp matching become the spectral axis.
Multiplex / broadband
- Sources
- Narrowband pump plus a broadband Stokes continuum
- Resolution
- Whatever the spectrograph and detector deliver
- Best for
- A full fingerprint spectrum per pixel where chemical identity is unknown
Tradeoff: Every wavenumber is recorded at once, but photons are spread across the array and each pixel needs far longer dwell.
Complete path
Every stage between the laser and the number you record.
Source
Shared clock, both colours
Chirp / filter
Set the bandwidth
Delay
Temporal overlap
Combine
Dichroic, collinear
Focus + scan
High-NA objective
Reject
Block pump and Stokes
Detect
PMT or spectrograph
3 · Pulses + delay
Bandwidth you cannot use is dose you cannot spend.
A femtosecond pulse delivers enormous peak power, but a molecular vibration only accepts the fraction of that bandwidth sitting inside its linewidth. The rest still reaches the sample, still generates non-resonant background, and still contributes to photodamage.
Pulse width
A 2 ps Gaussian pulse has about 7 cm⁻¹ of bandwidth; a 100 fs pulse has about 147 cm⁻¹. Condensed-phase Raman bands are 10–20 cm⁻¹ wide, so most of a femtosecond pulse is spent outside the band it is exciting.
Temporal overlap
Pump and Stokes must arrive within a fraction of a pulse width. Below that, the CARS signal simply vanishes — which is also the most reliable way to find time zero.
Synchronization jitter
Two separately mode-locked lasers need active timing stabilisation. An OPO pumped by the same laser, or two arms of one source, avoids the problem entirely.
Repetition rate
At 80 MHz the pulse energy is low and the average power dominates heating; at 1 MHz the pulse energy is 80× higher and peak-intensity damage arrives first. Both routes reach the same sample.
Dispersion
Every lens, dichroic, and the objective itself stretch the pulse. What matters is the pulse width at the focus, not at the laser output.
Chirp matching
In spectral focusing the two arms must carry identical chirp. If they do not, the difference frequency sweeps across the pulse and resolution degrades whatever the delay stage does.
Transform limit
Δν̃ ≈ 14.7 / τps cm⁻¹
For a Gaussian pulse: 2 ps gives about 7 cm⁻¹, 500 fs about 29 cm⁻¹, 100 fs about 147 cm⁻¹. Compare against a condensed-phase Raman linewidth of 10–20 cm⁻¹ and the picosecond preference for narrowband CARS follows directly.
Delay as a spectral axis
Δt = 2Δx / c
With a retroreflector, 1 µm of stage travel is 6.67 fs of delay. In spectral focusing that becomes a wavenumber step: a 100 fs pulse chirped to 2 ps tunes at roughly 74 cm⁻¹ per picosecond, so one wavenumber is about 2 µm of travel.
In spectral focusing, stage specifications become spectroscopy specifications.
Minimum incremental motion sets the finest wavenumber step. Repeatability sets whether a spectrum recorded on the way out matches the one recorded on the way back. Backlash appears as a shift between scan directions, and settling time is dead time in every pixel. None of that matters in a fixed-band microscope — and all of it matters the moment the delay stage is your wavelength knob.
Important: the pulse width that matters is the one at the focus. A high-NA objective plus dichroics and scan optics can stretch a sub-100 fs pulse substantially, which changes both peak intensity and effective resolution. Measure it at the sample plane, or budget for the pre-compensation that lets you.
4 · Detection chain
Decide what a pixel means before choosing the detector.
One number per pixel at megahertz rates, or a whole spectrum per pixel at kilohertz rates. That single choice determines the filters, the scan strategy, the acquisition electronics, and how long a field of view takes.
Rejection first
The anti-Stokes signal can be many orders of magnitude weaker than the excitation. Filter selection follows from the computed anti-Stokes wavelength, not from a catalog default.
Collection geometry
Forward detection needs a condenser matched to the excitation NA; epi detection reuses the objective and sees a different subset of scatterers.
Bandwidth vs. spectrum
A PMT gives microsecond dwell and one channel. An array gives hundreds of channels and millisecond dwell. There is no configuration that gives both.
Sampling the focus
Pixel size should sample the diffraction-limited spot, which in CARS is set by the excitation wavelengths — not by the shorter anti-Stokes wavelength you detect.
Forward CARS (F-CARS)
Condenser + filters + PMT or photodiode
Phase matching is naturally satisfied over the focal volume, giving the strongest signal from thin, transparent specimens
Needs optical access on both sides of the sample. Signal is dominated by objects larger than roughly the excitation wavelength.
Epi CARS (E-CARS)
Same objective, dichroic, PMT
Works on thick or opaque samples and suppresses the bulk solvent contribution
Backward signal comes mainly from small scatterers and interfaces, plus back-reflected forward signal — the contrast mechanism is not the same.
Point detector · PMT / APD
Single-channel, photon-counting or analogue
Megahertz bandwidth for pixel dwell times in the microsecond range — the only practical choice for video-rate raster scanning
One number per pixel. Anything spectral has to come from tuning, not from the detector.
Spectrograph + array
Cooled line CCD or back-illuminated sCMOS
A whole anti-Stokes spectrum per position, which is what makes multiplex CARS and background retrieval possible
Read noise, dark current, well depth and readout rate now set the pixel dwell time — a full spectrum per pixel costs milliseconds, not microseconds.
5 · Design lab
Put the Raman shift, the pulse width, and the detector on one budget.
Set the vibration you want and the lab returns the Stokes wavelength you have to source, where the signal lands, whether silicon can see it, what the excitation resolves, and what the focus is doing to your sample. Switch schemes to see how the same target changes the hardware.
Model the experiment
CARS design lab
Two narrowband picosecond beams parked on the 2 845 cm⁻¹ CH₂ stretch — the classic single-band CARS microscope.
Where the three colours land
Excitation resolution is 10.4 cm⁻¹ against a 15 cm⁻¹ target. Shorter pulses buy peak power and lose spectral selectivity — condensed-phase bands are typically 10–20 cm⁻¹ wide, so a sub-picosecond pulse spends most of its bandwidth outside the band.
The signal at 650 nm sits 147 nm blue of the pump. A silicon detector covers it, and the blue shift is what keeps one-photon fluorescence — which is always red of the excitation — out of the detection band.
40 mW combined at the sample, 0.31 nJ per pump pulse, 28.5 GW/cm² at focus. Damage thresholds are sample-specific: verify by scanning power and repetition rate independently and watching for a signal that no longer scales as expected.
Gaussian pulses and a diffraction-limited Airy focus are assumed throughout. Resolution in spectral-focusing mode is the best case for perfectly matched chirp on both arms. Relative yield uses the resonant CARS scaling P̄p²·P̄S / (f²·τ²·A³), normalised to the CH₂ preset — it compares configurations and is not an absolute photon count. It also ignores the non-resonant background, which scales differently and often decides whether a weak band is usable at all.
6 · Background + artifacts
The background is a physical signal, not noise.
Averaging does not reduce it, and no filter separates it. Every practical CARS system deals with the non-resonant term either optically, at the point of excitation, or numerically, after the spectrum is recorded.
Non-resonant background
A featureless four-wave-mixing pedestal from the electronic response of solvent, glass and immersion medium — present even with no vibration in range.
Picosecond excitation, off-resonance reference images, polarization CARS, time-delayed probing, or a spectral fit that models the interference explicitly.
Dispersive lineshapes
Peaks look shifted, asymmetric or dip below the baseline because the resonant and non-resonant terms interfere in amplitude, not intensity.
Retrieve the imaginary part of χ⁽³⁾ — maximum-entropy or Kramers–Kronig — before comparing anything with a spontaneous Raman library.
Photodamage
Signal drops during a scan, or morphology changes between frames; often nonlinear in power and worse at low repetition rate.
Scan average power and repetition rate independently, move to a fresh field, and confirm the signal still scales as expected against pump and Stokes power.
Imperfect overlap
Signal is weak but the spectrum looks right — or the signal appears and disappears with focus.
Optimise spatial overlap at the sample plane and temporal overlap on delay; both beams must be collinear through the full pupil, not just at the objective back aperture.
Pump and Stokes leakage
Excitation light reaching the detector inherits every fluctuation of the laser.
Short-pass and bandpass filtering chosen from the actual anti-Stokes wavelength, plus spatial and angular rejection. Verify with each beam blocked in turn.
Two-photon fluorescence
A broad background that survives when the beams are temporally separated.
Block one beam, change the delay far beyond overlap, and compare — any surviving signal is not CARS.
Block the Stokes
Everything that remains is not CARS.
Move off resonance
A few hundred wavenumbers away isolates the non-resonant pedestal.
Separate in time
Delay the beams past overlap; the coherent signal disappears, backgrounds may not.
Scale the power
Resonant CARS follows pump² × Stokes. Anything that does not is something else.
7 · Relevant products
Build the instrument stack from the vibration outward.
Catalog-backed starting points for ultrafast excitation, the delay arm that carries the spectral axis, beam routing, spectral dispersion and detection. They are components, not a turnkey microscope — the second colour, the objective, the scanner and the filter set still need to be designed around your target band.
Ultrafast excitation
FS-H-1030B
An 80 MHz femtosecond source at 1030 nm with 0.5–3 W of average power — the usual starting point when one laser has to feed both arms of a chirped-pulse CARS setup.
- Output / average power
- 500-3000 mW
- Repetition rate
- 80±2 MHz
Qualify: Confirm pulse width and spectral bandwidth at the sample after the objective, available power for a second colour, and the trigger or clock output the detection chain will use.
FS-H-10 64B
An 80 MHz femtosecond source at 1064 nm with 0.5–5 W, for systems that build the Stokes branch on the fundamental and derive the pump from parametric conversion.
- Output / average power
- 500-5000 mW
- Repetition rate
- 80±2 MHz
Qualify: Check pulse width, power stability over an imaging session, and whether the beam quality supports diffraction-limited focusing at high NA.
FL-H-1030-PS
A picosecond 1030 nm fiber platform at 1–20 W, for the narrowband scheme where spectral selectivity — not peak power — is the design goal.
- Output / average power
- 1~20 W
- Beam / notes
- Picosecond Pulsed Infrared Laser
Qualify: Ask for the actual pulse width and optical bandwidth, not just the picosecond classification: 2 ps and 20 ps are different instruments for this application.
Delay line and beam gating
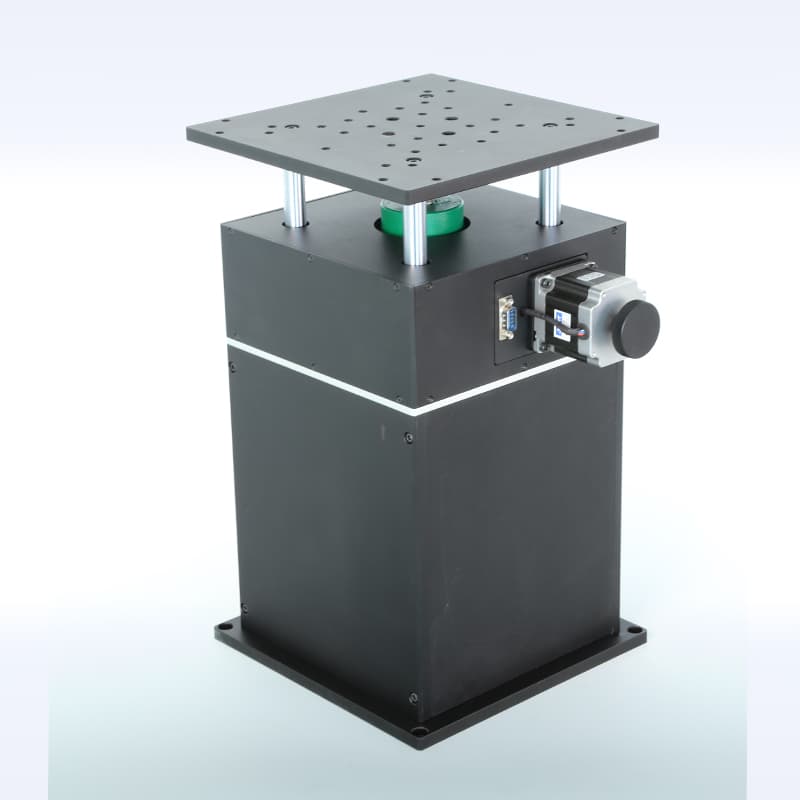
LAK20-60
In spectral focusing the delay stage is the spectral axis. A submicron-class compact stage covers the full chirped bandwidth in a couple of millimetres of travel while keeping each step small compared with a wavenumber.
- Mechanical travel
- 20 mm
- Double-pass delay window
- ≈ 133 ps
- Minimum incremental motion
- ≤ 1 µm · ≈ 6.7 fs
- Fine-subdivision resolution
- 0.1 µm · ≈ 0.67 fs
- Repositioning accuracy
- ≤ ±1 µm
- Maximum speed
- 20 mm/s
Qualify: The stage is the moving platform, not the delay line. Add a retroreflector or roof-mirror assembly, a compatible controller, and confirm settling time, approach direction and real optical repeatability in the assembled geometry. If you also need a long-window pump–probe arm, the 150 mm LA150-60 covers roughly a nanosecond.
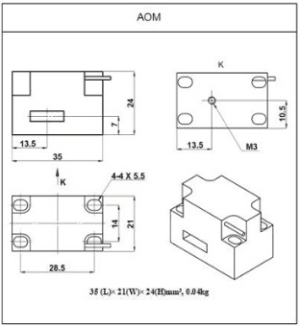
AOM-I acousto-optic modulator
Fast gating keeps light off the sample between scan lines, sets a modulation pattern for lock-in detection, or reduces an 80 MHz train to a rate the sample survives.
- 450–700 nm
- 100 MHz centre frequency
- Up to 4 MHz pulse repetition
- 80% diffraction efficiency
- TTL / analogue control
Wavelength check: The catalog AOM-I is specified for 450–700 nm and typical optical power below 1 W with a 1.0 mm beam — a visible-band device. For a near-infrared CARS excitation beam, confirm wavelength coverage, single-pulse energy, dispersion, extinction ratio and rise time with the supplier before assuming it fits.
Zolix beam-routing optomechanics
Pump and Stokes have to stay overlapped in space and angle through the full objective pupil, over hours. Mount stability is not a detail here — a drift of a fraction of a beam diameter is a drift in signal.
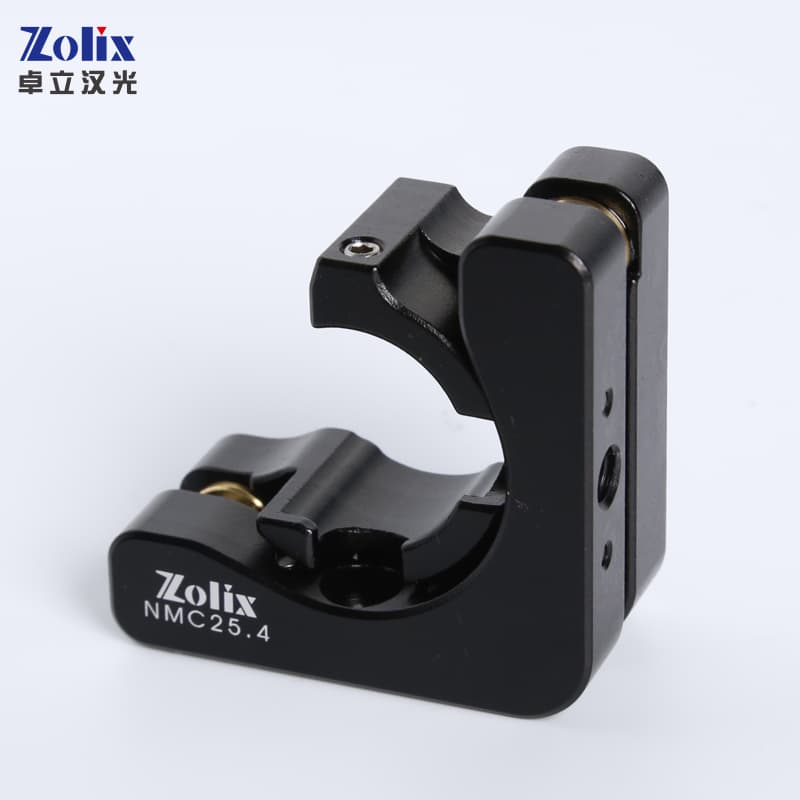
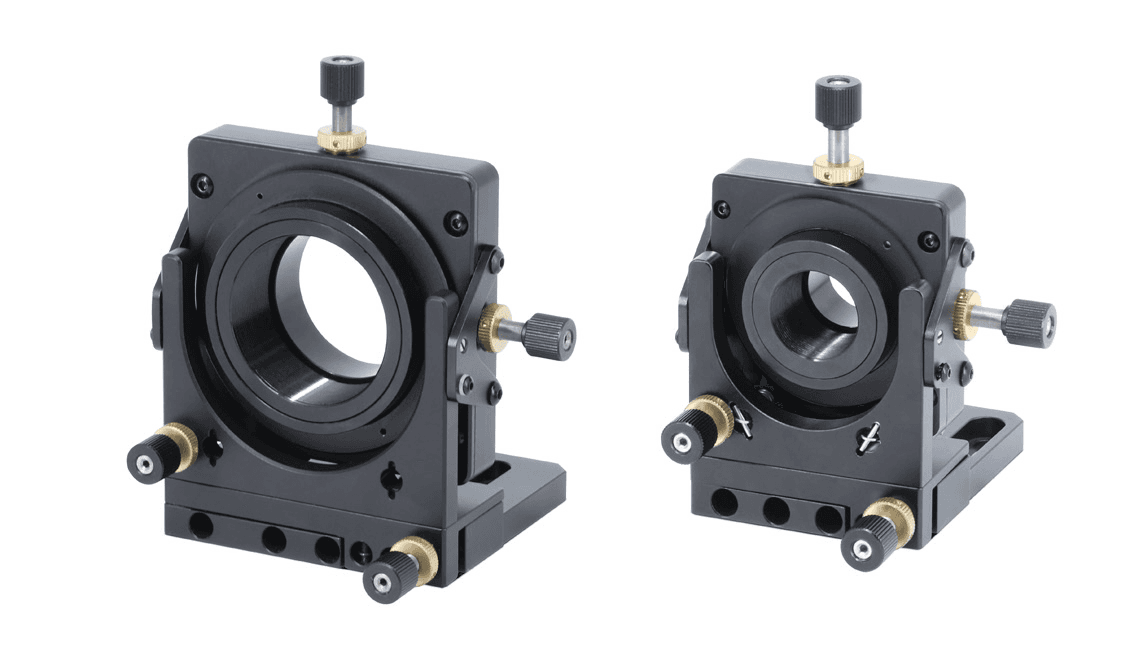
NMC25.4
Centre kinematic mount for Ø25–25.4 mm optics — the dichroic and the fold mirrors that bring pump and Stokes onto a common axis.
- ±3° angular range
- Ø23 mm clear aperture
- 25 mm optical-axis height
NMUM25.4
Five-axis mount for a 25.4 mm optic, for the collinearity adjustment that has to hold both beams overlapped through a high-NA objective.
- ±2.5 mm X/Y
- 6 mm Z travel
- ±5° tip/tilt
NPH50
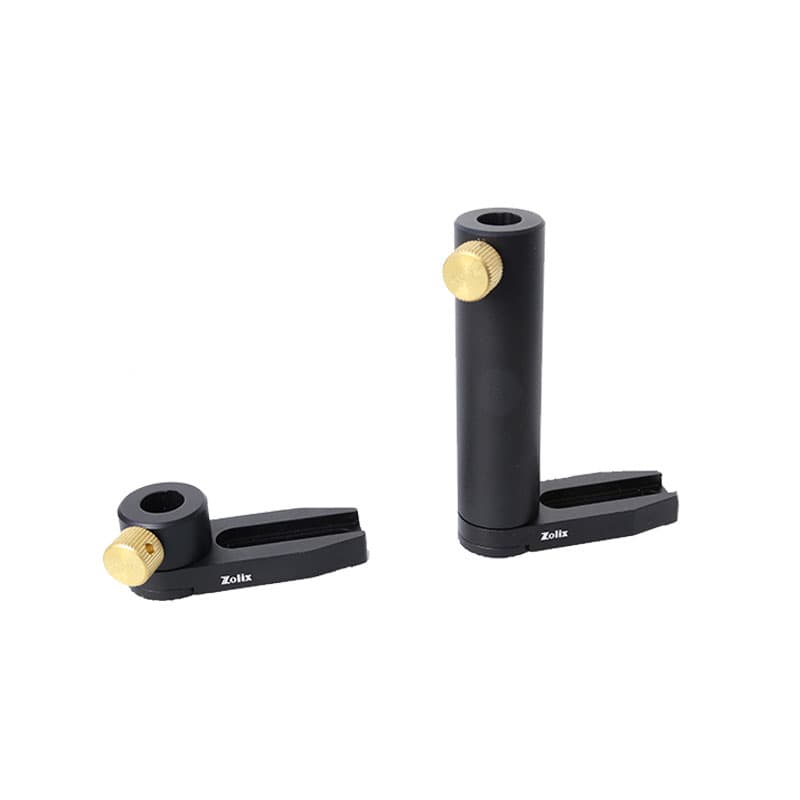
Compact base-mounted holder for Ø12 mm posts, keeping the delay arm and the combining optics at one table height.
- Ø12 mm post
- 50 mm overall height
- Base-mounted holder
Spectrographs for hyperspectral CARS
HiperS-320i
Toroidal on-axis mirrors keep the focal plane free of astigmatism, which matters when a broadband anti-Stokes spectrum must stay sharp across a whole line array or when signal and reference occupy separate tracks.
- 320 mm focal length
- f/4.4 aperture
- Aberration-corrected focal plane
- Triple grating turret
Qualify: Choose grating, blaze, slit width, input f/number and detector format together — the anti-Stokes span from the design lab tells you how much of the focal plane you actually need.
Omni-λ300i
A practical 320 mm Czerny–Turner platform when moderate resolution, throughput and grating flexibility have to coexist on one budget.
- 320 mm focal length
- f/4.2 aperture
- Triple grating turret
- Multiple entrance/exit ports
Qualify: Work out the wavenumber-per-pixel on the actual sensor before buying resolution. In CARS the limit is usually photons per pixel, not grating dispersion.
Detectors for the anti-Stokes signal
sCCD01AM
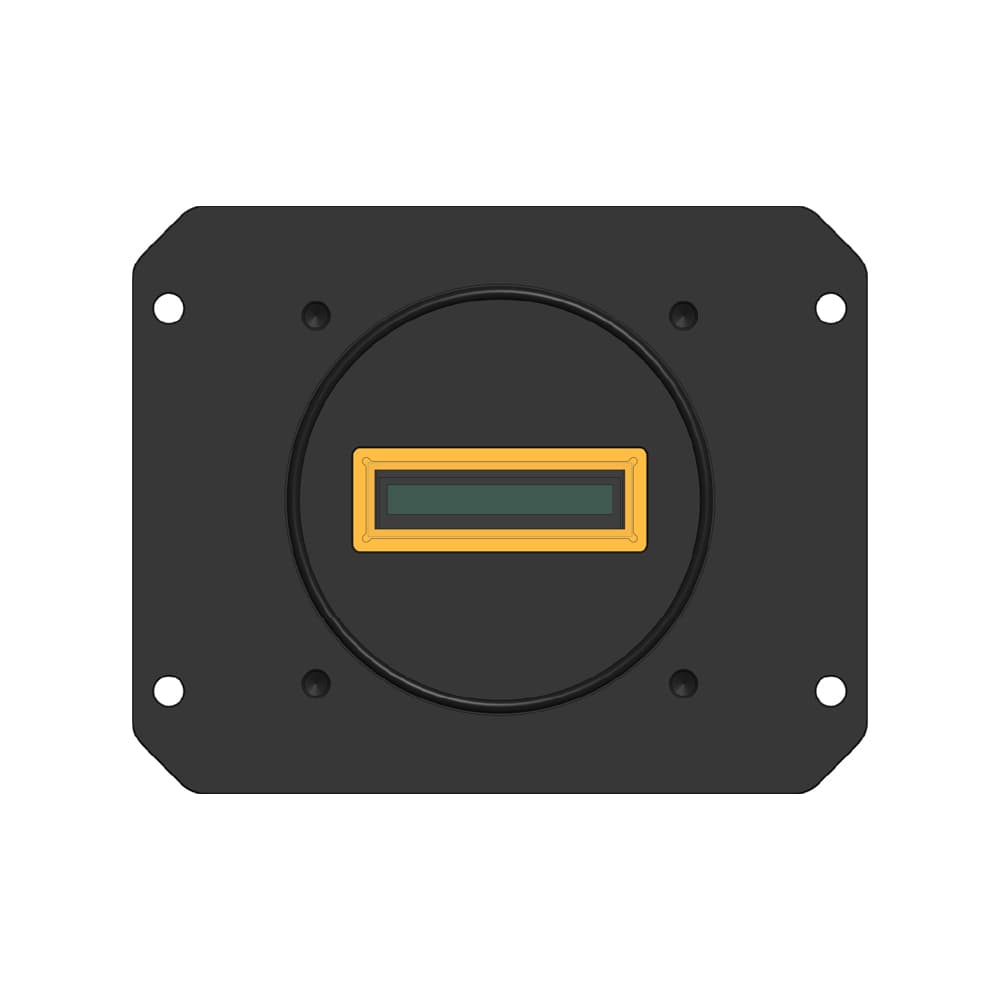
A 2048 × 1 deep-cooled scientific CCD with 15 µm pixels, a 30.7 mm active length, 459 ke⁻ full well and 95% quantum efficiency at 800 nm — a line detector built for a spectrograph focal plane rather than an imaging port.
- Sensor
- E2V CCD261
- Resolution
- 2048 × 1
- Pixel Size
- 15 µm × 15 µm
- Frame Rate
- 12 fps @ 2048 × 1
- Interface
- USB3
Qualify: The 300–1000 nm range covers anti-Stokes signals from all the usual pump/Stokes pairs. Check cooling (55 °C below ambient), the 22 e⁻ read noise against your per-pixel photon budget, and whether 12 fps is compatible with your scan pattern.
sMAX04BM-CL100
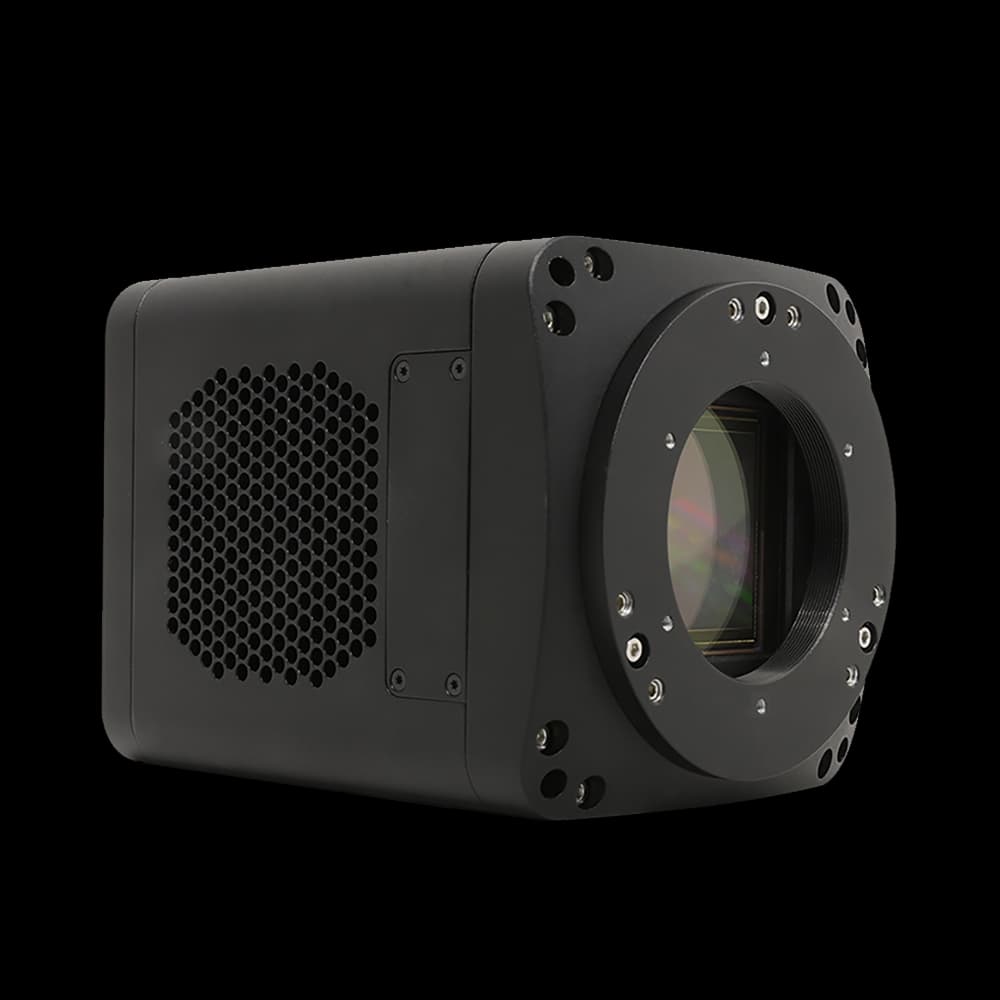
A 2048 × 2048 back-illuminated sCMOS with Camera Link and 108 fps full-frame readout, for imaging CARS geometries and for spectra that need more than one detector track.
- Sensor
- GSENSE2020BSI (sCMOS)
- Resolution
- 4.2 MP (2048×2048)
- Pixel Size
- 6.5 µm × 6.5 µm
- Frame Rate
- 108 fps @ 2048×2048; 108 fps @ 1024×1024
- Interface
- Camera Link
Qualify: Verify ROI timing, external trigger behaviour and read noise at the gain you will actually use. Full-frame rate is not the same as usable spectra per second once dwell and scan overhead are included.
Want the whole CARS chain reviewed?
Bring the target Raman shift and band linewidth, the sample and its damage limits, the field of view and frame rate you need, and whether the result has to be comparable with a spontaneous Raman spectrum.
8 · Specification brief
Specify a measurement, not a shopping list.
These are the inputs that expose the interfaces between laser, mechanics, optics, detector and software before anything is quoted.
Target vibration
Raman shift in cm⁻¹, band linewidth, expected cross-section relative to a known reference such as CH₂ at 2 845 cm⁻¹.
Excitation scheme
Narrowband, spectral focusing, or multiplex — and therefore how the Raman shift is changed between measurements.
Sources
Pump and Stokes wavelengths, pulse widths at the sample, repetition rate, synchronization method and residual timing jitter.
Delay
Overlap range, step size in wavenumbers, repeatability, and whether the delay stage is scanned during acquisition or only set.
Sample
Thickness, refractive index, immersion medium, damage threshold, motion, and whether epi access is required.
Filtering
Anti-Stokes wavelength, required blocking of pump and Stokes, and the optical density needed at the detector.
Detection
Point detector or spectrograph plus array; bandwidth, dwell time, quantum efficiency at the anti-Stokes wavelength, and read noise.
Acquisition
Pixel dwell, field size, frames averaged, background reference strategy, and how spectra will be phase-retrieved.
9 · Common questions
Short answers before the design review.
What is CARS microscopy?+
Coherent anti-Stokes Raman scattering microscopy is a label-free imaging technique. Two synchronized laser beams — pump and Stokes — are focused into a sample; when their frequency difference matches a molecular vibration, the vibration is driven coherently and a third field scatters off it to produce a directional signal at a new, blue-shifted wavelength. Contrast comes from the molecule's own chemical bonds, so no dye or fluorescent label is needed.
How is CARS different from spontaneous Raman?+
Spontaneous Raman scattering is incoherent and extremely weak, which is why a Raman map can take hours. In CARS the vibrations are driven in phase, so the emitters add coherently and the signal can be several orders of magnitude stronger — enough for video-rate imaging. The price is a non-resonant background, interference-distorted lineshapes, and two synchronized pulsed sources instead of one CW laser.
Why does the signal come out at a shorter wavelength?+
The anti-Stokes photon carries the energy of two pump photons minus one Stokes photon, so it is higher in energy than any input photon. Because one-photon fluorescence is always red-shifted from the excitation, a blue-shifted signal can be separated from fluorescence with a filter — the main practical advantage over Stokes-side techniques.
What is the non-resonant background and can it be removed?+
It is four-wave mixing from the instantaneous electronic response of the sample and its surroundings, present whether or not a vibrational resonance is being driven. It cannot be filtered away, because it appears at exactly the anti-Stokes wavelength. It can be suppressed — picosecond excitation, polarization CARS, epi detection, time delay — or accounted for by retrieving the imaginary part of the third-order susceptibility from a measured spectrum.
Do I need picosecond or femtosecond pulses?+
Picosecond pulses match the width of a typical condensed-phase Raman band and give the best ratio of resonant signal to non-resonant background. Femtosecond pulses give more peak power and more bandwidth than a single band can use, but with matched chirp on both arms — spectral focusing — they recover picosecond-like resolution while letting a delay stage tune the Raman shift.
Should I detect with a PMT or with a spectrograph and camera?+
Use a point detector when the Raman shift is fixed and the goal is a fast image: microsecond dwell times and megahertz bandwidth are only available that way. Use a spectrograph and an array detector when you need the spectrum itself — for unknown chemistry, for overlapping bands, or because you intend to phase-retrieve the lineshape. Many systems carry both.
How does CARS compare with SRS?+
Stimulated Raman scattering measures the intensity change of the excitation beams themselves rather than a new colour. It has no non-resonant background and its spectra match spontaneous Raman directly, but it requires modulation and lock-in detection because the signal is a small fractional change on a bright beam. CARS needs no lock-in chain and produces a background-free-looking wavelength, at the cost of the interference. The laser and scanning hardware are largely shared.
Research basis
This guide is an engineering overview. Representative primary work behind the scheme comparison, pulse-width argument, spectral focusing, and background retrieval:
- 1. Zumbusch, Holtom & Xie, “Three-dimensional vibrational imaging by coherent anti-Stokes Raman scattering,” Physical Review Letters 82, 4142 (1999).
- 2. Cheng, Volkmer, Book & Xie, “An epi-detected coherent anti-Stokes Raman scattering (E-CARS) microscope with high spectral resolution and high sensitivity,” Journal of Physical Chemistry B 105, 1277 (2001).
- 3. Hellerer, Enejder & Zumbusch, “Spectral focusing: high spectral resolution spectroscopy with broad-bandwidth laser pulses,” Applied Physics Letters 85, 25 (2004).
- 4. Vartiainen, Rinia, Müller & Bonn, “Direct extraction of Raman line-shapes from congested CARS spectra,” Optics Express 14, 3622 (2006).
- 5. Evans & Xie, “Coherent anti-Stokes Raman scattering microscopy: chemical imaging for biology and medicine,” Annual Review of Analytical Chemistry 1, 883 (2008).
Continue designing