Application example
Following a cytotoxic response over time
An endpoint can hide when a treatment response begins. This documented HeLa-cell experiment combined brightfield and green-fluorescence images during nocodazole exposure to follow changes in cell coverage and membrane integrity over 48 hours.
Discuss your experiment →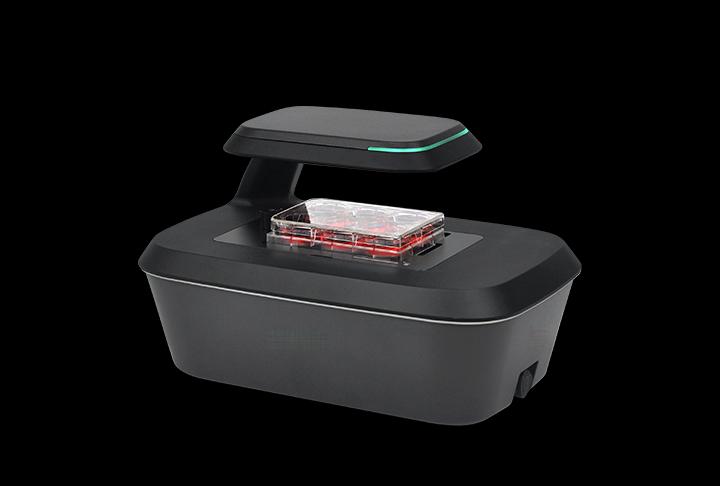
Reported experimental setup
- Sample
- HeLa cells seeded at 1 × 10⁴ cells per well in a 48-well plate, cultured overnight before treatment.
- Treatment shown in the source figures
- Untreated control and nocodazole at 31.25, 62.5 and 250 nM.
- Acquisition
- Brightfield and green fluorescence every hour for 48 hours in an incubator.
- Readout
- Membrane-integrity dye; fluorescent area relative to brightfield confluence, reported as a percentage.
- 1
Count and seed cells consistently
- 2
Acquire paired brightfield and fluorescence images
- 3
Review morphology and the fluorescence/confluence readout
What was reported
The note reports concentration-dependent morphological changes and reduced brightfield confluence, together with increasing fluorescence from membrane-compromised cells over time. Combining the channels gives context for the response trajectory rather than relying on a final fluorescence value alone.
Interpretation limits
An area ratio is not automatically the percentage of dead cells: cell size, detachment, overlap and segmentation affect it. A membrane-integrity dye does not identify an apoptosis mechanism by itself. Dye compatibility, background, phototoxicity and appropriate controls must be checked for the actual cells. This summary does not infer an IC50, a universal detection limit or independent validation.
Specify the imaging and counting steps together
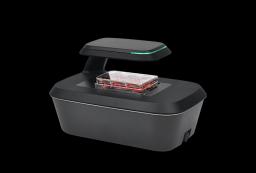
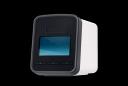
The example uses a compact motorised imager with brightfield and a green-fluorescence configuration. Confirm the exact dye spectrum against the filter set and test an exposure schedule on your cells. The reported one-hour interval is an experimental setting, not a requirement for all cytotoxicity assays.
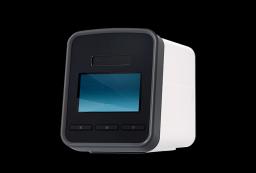
A reproducible starting suspension matters before imaging begins. A compatible brightfield counter can support the seeding step, while the imager follows the attached culture over time. Those instruments report different quantities. Compare cell concentration and viability before seeding separately from image-based confluence and fluorescence after attachment.
Instruments for this workflow
Check the exact configuration and assay compatibility on the product page. Inclusion does not establish validation for every sample.
Sources and scope
Original summary of a 2022 instrument application note on nocodazole-induced cytotoxicity. Reported experimental example, not an independent validation or work performed by Precisometer. No experimental images or curves from that note are reproduced here.
Details for instrument selection
- Cell type, seeding density, vessel and treatments
- Fluorophore, controls and required readout
- Imaging positions, interval and exposure duration
Discuss your experiment
Tell us what you need to measure. Next, add your contact details and review the enquiry before sending.
Selection help and applications
Imaging comparison
Choosing a live-cell imaging system →
Compare six imaging systems by vessel workflow, objectives, fluorescence and incubator fit, then specify the configuration for your experiment.
Cell-counting guide
Choosing a cell counter for cell culture →
Choose a counting method by cell type, concentration, viability stain and sample workload. Compare counters and plan a sample-specific evaluation.
Application example
Tracking wound closure with time-lapse imaging →
A documented NIH-3T3 scratch-assay example: brightfield imaging every 30 minutes for 72 hours, wound-area analysis and interpretation limits.