Large-area photocurrent mapping
SCS800 Solar Cell Defect Mapping System
SCS800 uses galvanometer-scanned laser excitation to map photocurrent and photovoltage across solar cells and photoelectric materials. Field options up to 300 × 300 mm support spatial uniformity studies and defect localisation.
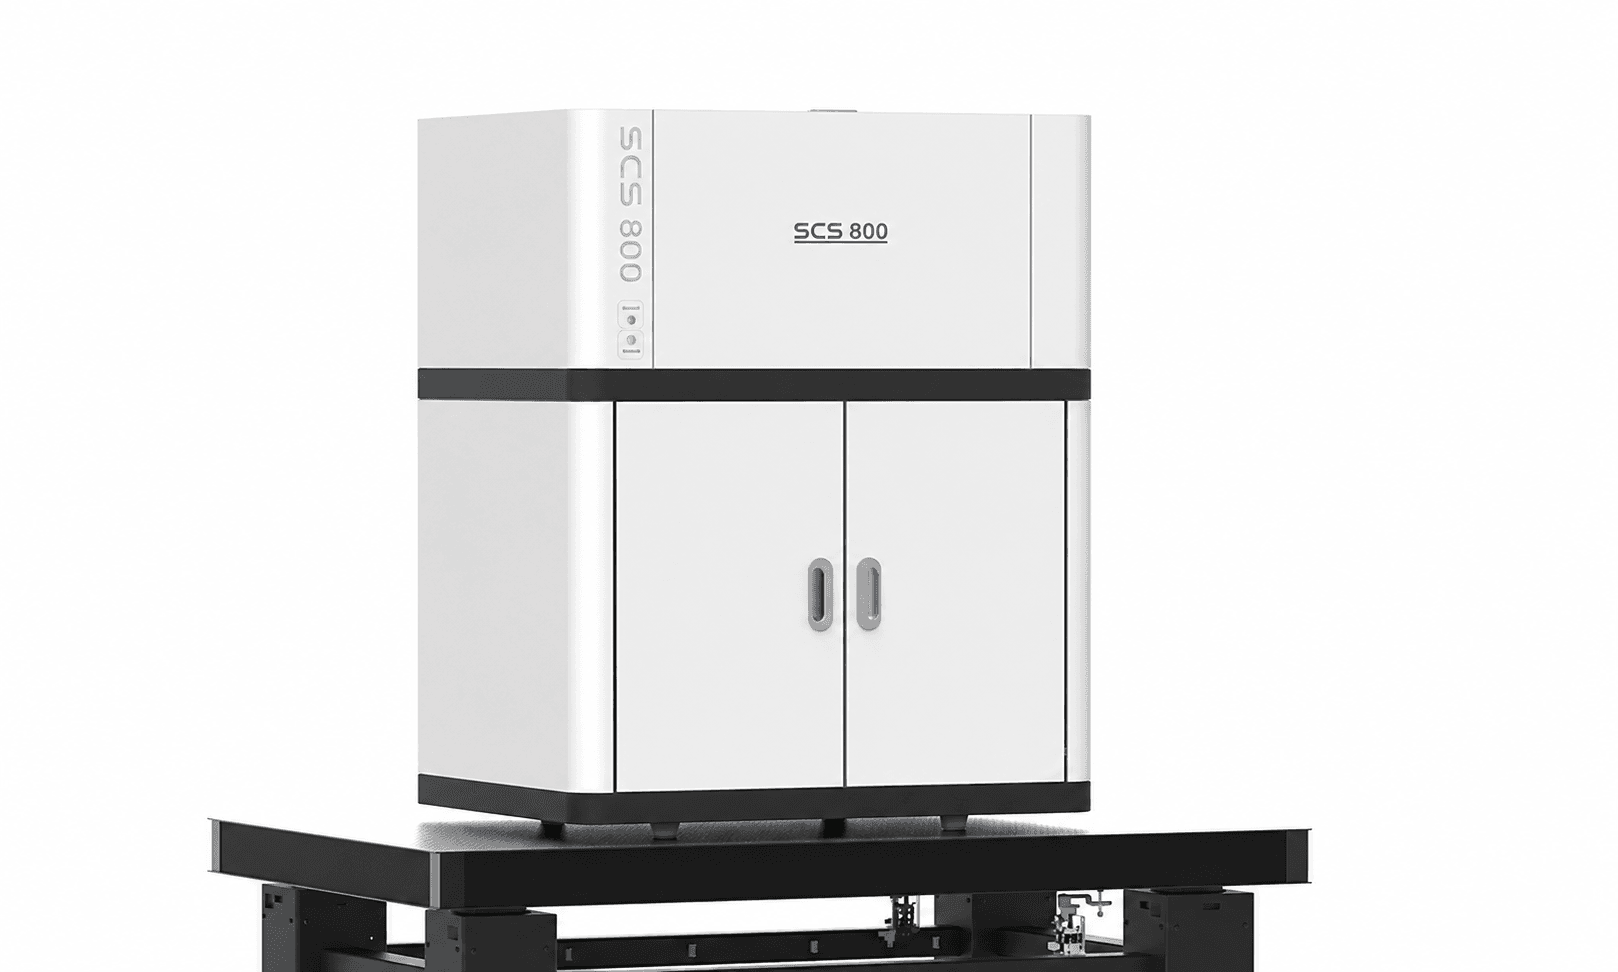
- 300 × 300 mm
- Largest scan field
- < 100 µm
- Specified resolution
- 532 nm
- Standard laser
- 1 nA–1 A
- Current range
Overview
About the SCS800
SCS800 associates laser position with the electrical response of the sample to produce current and voltage maps. These maps help identify local conversion losses and guide process optimisation.
Choose the scan field and excitation wavelength for the material. An optional vacuum sample stage supports water cooling and multiple probe contacts for different solar-cell busbar layouts.
Features
- Galvanometer scanning with false-colour response maps
- Additional 405, 532, 635 and 808 nm laser options
- Optional vacuum holding and temperature-controlled sample stage
Applications
- Silicon and perovskite cell defect localisation
- Large-area photoelectric response uniformity
- Photovoltaic research and quality screening
Technical data
Specifications & Configuration
| Scan-field options | 100 × 100, 200 × 200 or 300 × 300 mm |
|---|---|
| Spatial resolution | < 100 µm in the instrument parameter table |
| Standard laser | 532 nm; power stability ±1% over 4 hours |
| Current range | 1 nA–1 A |
| Dark noise | 100 pA |
| Current resolution | 20 fA |
| Acquisition accuracy | 0.03% |
| Stage | 300 × 300 mm with vacuum holding |
|---|---|
| Water cooling | 5–35 °C; temperature-control accuracy ±0.1 °C |
| Contacts | Six probes; configurations for 3, 4, 5, 6, 9, 12 or 16 busbars |
Download the datasheet
Measurements, specifications and configuration options.
Related Photoelectric Systems
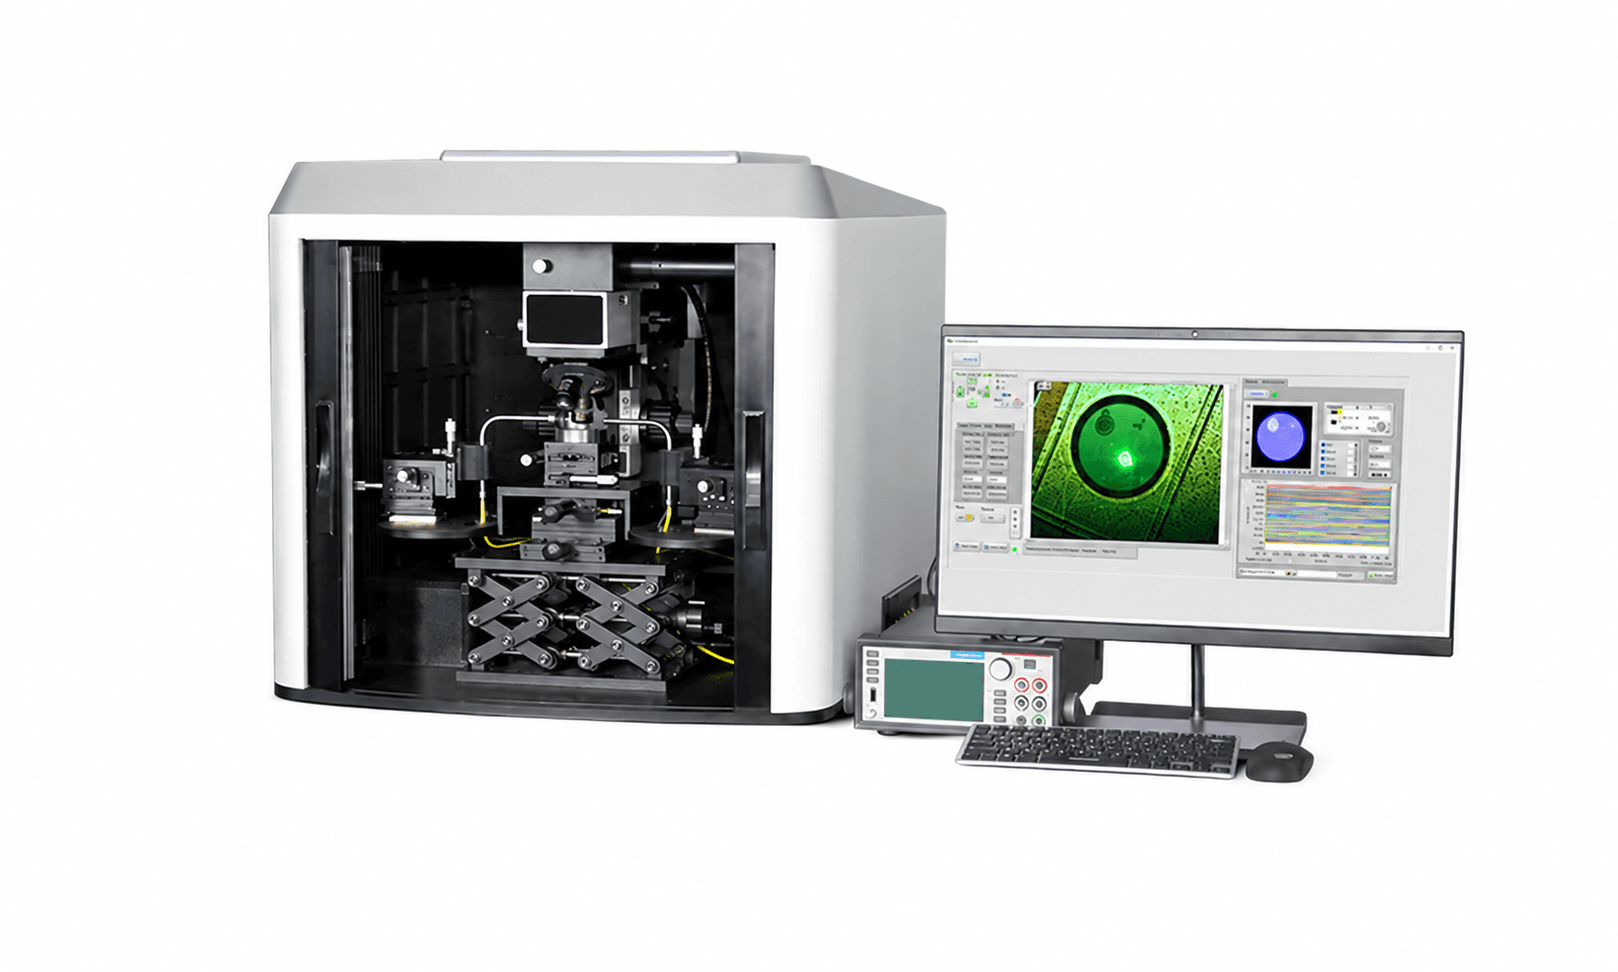
Microscopic LBIC mapping
DSR500-LBIC
DSR500-LBIC uses a galvanometer-scanned microscope to record local photocurrent and I–V curves while the sample remains stationary. The standard 20× objective provides a 260 × 200 µm scan field, with selectable scan steps down to 0.2 µm.
- Scan field at 20×
- 260 × 200 µm
- Minimum scan step
- 0.2 µm
- Laser spot
- 2 µm
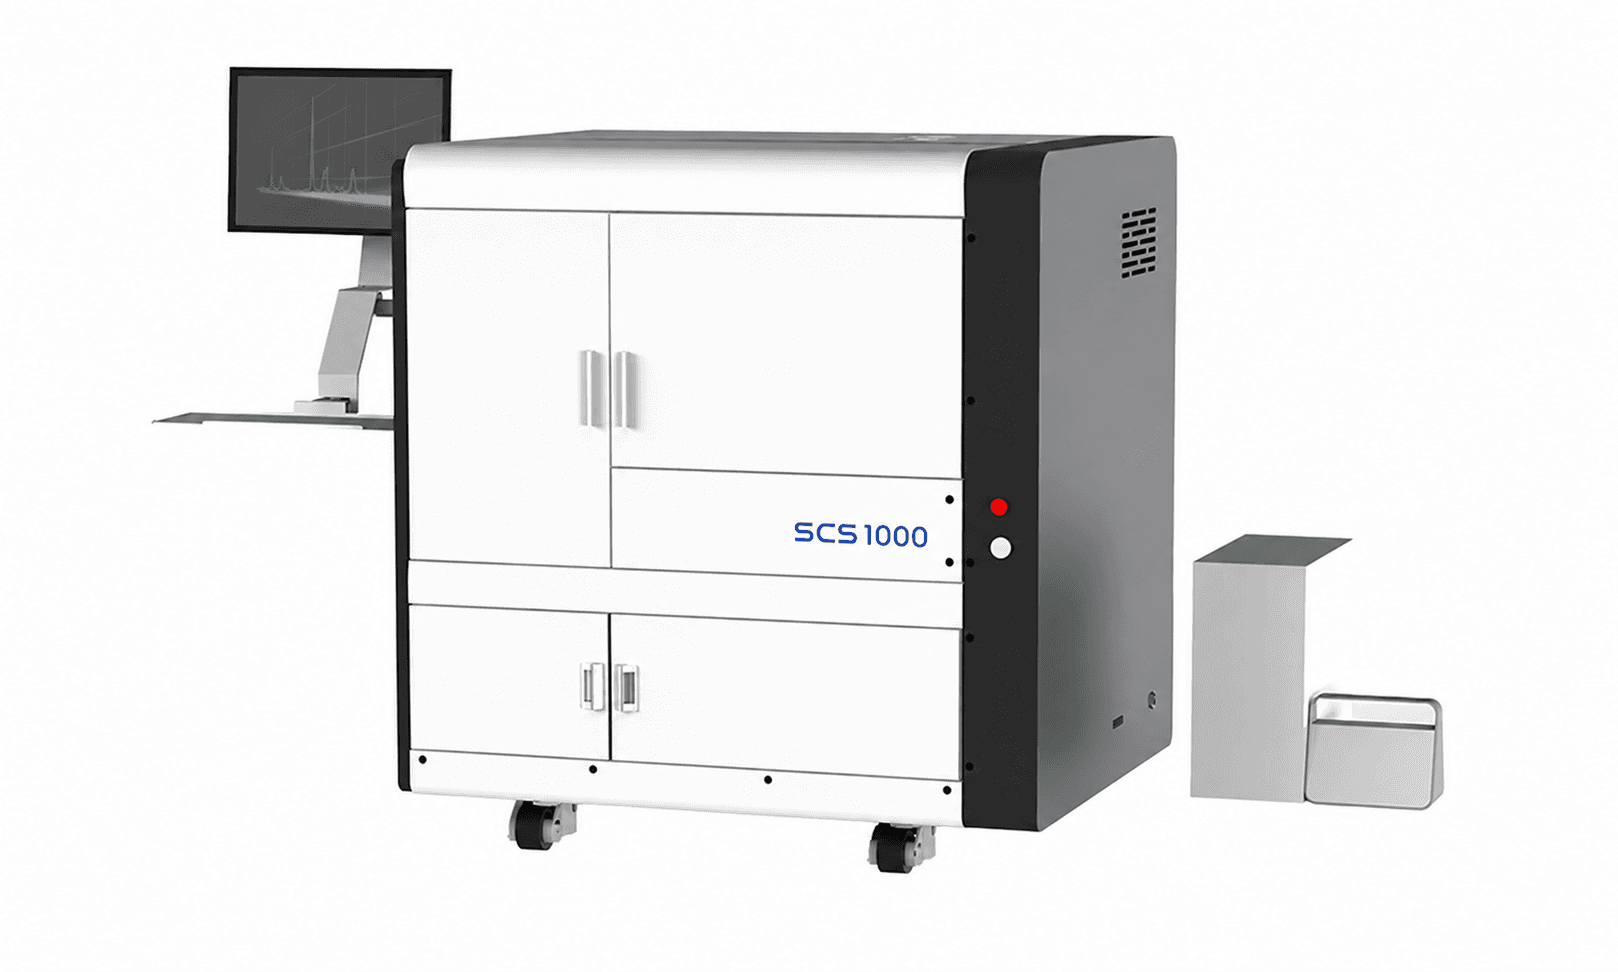
Automated spectral response and mapping
SCS1000
SCS1000 is an integrated quantum efficiency platform with software-controlled measurement modes, reference-detector switching and spot selection. Measures spectral response, EQE and IQE with optional reflectance, transmittance and mapping functions.
- Minimum spot
- < 1 mm
- Operation
- Automated switching
- Acquisition options
- AC / DC
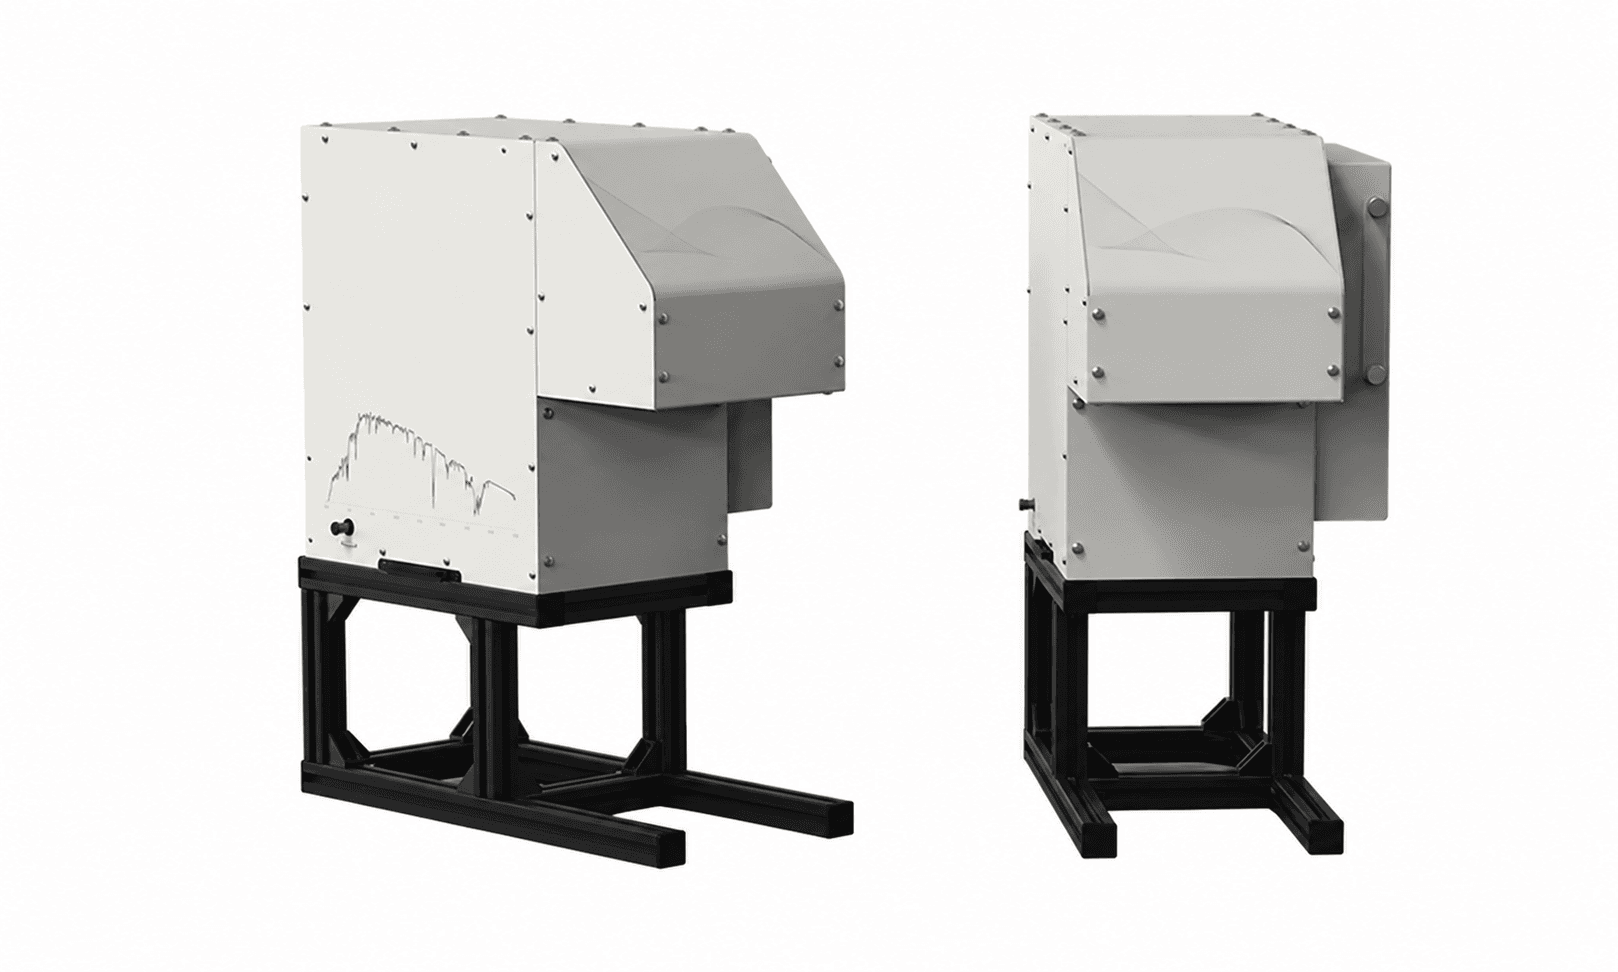
Photovoltaic I–V characterisation
SolarIV
Measure illuminated and dark I–V curves, conversion efficiency, fill factor and series and shunt resistance. SolarIV-150A and SolarIV-300A combine a solar simulator, digital source meter, reference cell and analysis software.
- Illuminated area
- 40 × 40 / 60 × 60 mm
- Measurements
- Light & dark I–V
- Reference cell
- QE-B1 included
Configure the SCS800 for your experiment
Tell us your sample size, wavelength range and measurement requirements for a configuration and quotation.
Request a Quote