Where does a response originate?
Compare stimulation locations and response measurements to investigate spatially organized inputs. A response map needs optical and biological validation.
Neuroscience · Application guide
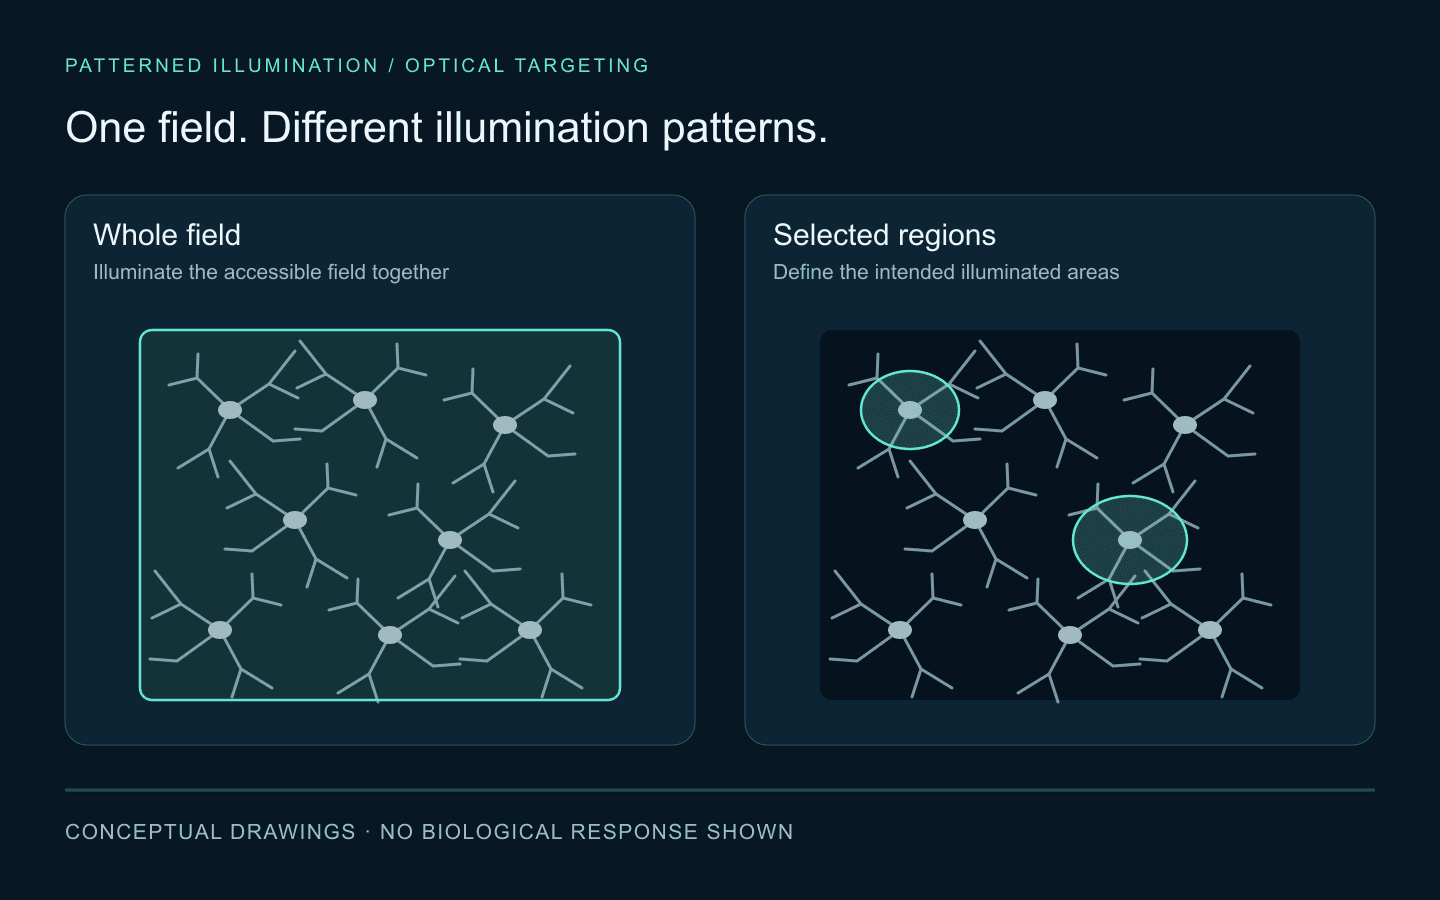
What happens when you stimulate one selected region instead of illuminating the entire field?
Plan spatially defined stimulation in a neuronal culture or tissue slice, then record the response with electrophysiology or a compatible imaging setup.
01 / A spatial question
Whole-field illumination exposes the accessible field together. Patterned stimulation lets you compare defined locations or combinations while holding the recording arrangement constant. In a culture, that might mean comparing two parts of a dendritic arbor. In a slice, it might mean testing spatially separated input regions while recording from one cell.
Compare stimulation locations and response measurements to investigate spatially organized inputs. A response map needs optical and biological validation.
Present region A, region B and A + B to investigate integration, with a consistent measurement and suitable controls.
Compare selected pattern orders and intervals to investigate temporal interactions, adaptation or network recruitment.
An ROI defines where you intend to deliver light. It does not identify every membrane or cell that will respond. Axons and dendrites from other cells may pass through it; scattered or defocused light may reach surrounding structures; expression and network activity affect the recording. Establish selectivity in the preparation rather than assigning it from the mask alone.
Published application / cultured hippocampal neurons
Avants, Murphy, Dapello and Robinson (2015) combined a Polygon400, NeuroPG and whole-cell patch clamp to map responses in ChR2-expressing rat hippocampal cultures. They also stimulated two dendritic regions separately and together; in the illustrated experiment, the combined depolarization exceeded the sum of the individual responses.
This demonstrates a spatial stimulation-and-recording workflow in that preparation. It does not establish a universal dose, single-cell isolation in scattering tissue, or current software compatibility. The paper used an earlier Polygon generation; assess a new installation on current specifications.
Avants et al. (2015), NeuroPG — original research · Manufacturer application note (PDF)
02 / The optical principle
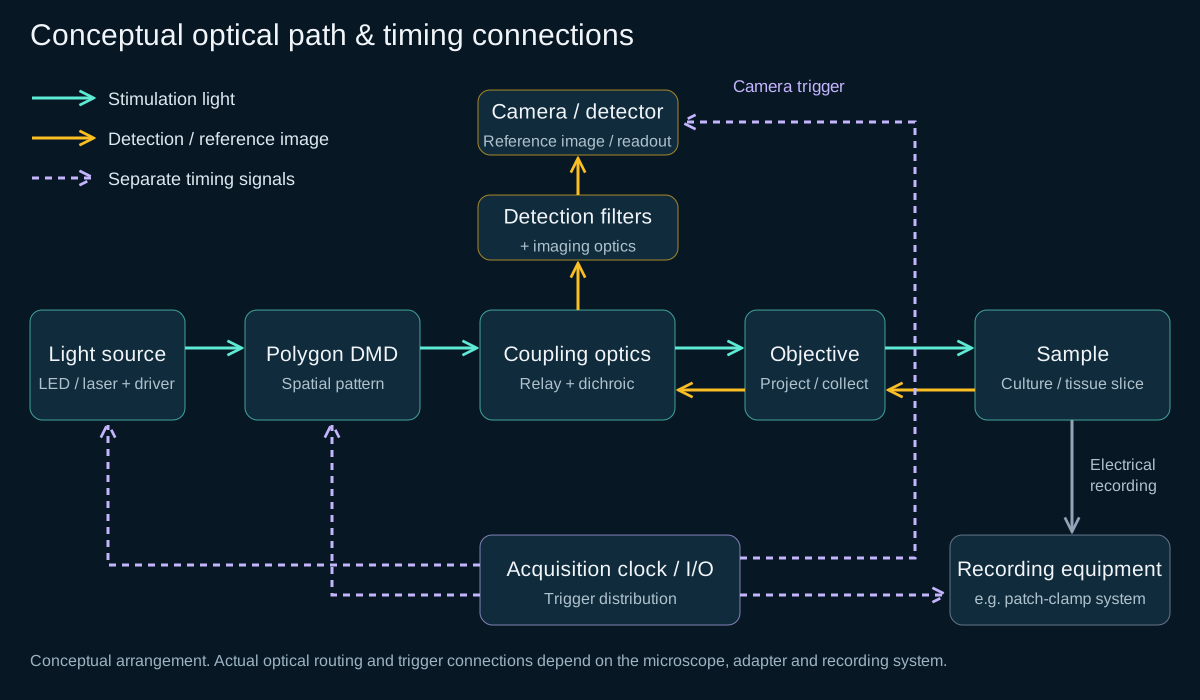
Mightex Polygon is a digital micromirror device (DMD) patterned illuminator. A light source illuminates the mirror array; selected mirrors direct light into the projection path, while others direct it away. Microscope coupling optics and the objective relay the selected pattern to the sample. The Polygon shapes incoming light; the source and its driver supply and gate it. Mightex’s principle and product overview.
01
Use a camera view with identifiable features and the same optical configuration you will use for targeting.
02
Select the intended regions in image coordinates; these may be single areas or grouped masks.
03
Map camera coordinates to DMD coordinates, accounting for orientation, scale and relevant distortion.
04
Inspect independent patterns at the specimen plane before interpreting a biological response.
Mightex describes camera-to-DMD calibration and pattern design on its Polygon software overview. The verification steps above are experimental planning recommendations.
03 / Interactive ROI illustration
Select labelled regions, then preview them individually or together. Compare the reference drawing with the intended projected mask. No neuronal activity is simulated.
Interactive illustration · no hardware control or biological response model
Use A–D to select regions. They run in selection order.
Conceptual neuronal drawing; no physical scale or measured fluorescence.
Ideal coordinate alignment is assumed in this illustration.
Ideal binary illumination mask. A blank mask does not establish zero specimen-plane light.
Selection order: A → C
Step 1 of 4: Blank mask
Steps have no specified duration. This preview illustrates masks and order only; the microscope needs measured registration, optical verification and validated timing.
04 / Experimental planning
Choose the comparison: one region versus the whole field, separate inputs versus their combination, or the same regions in different orders. Define the structure to target, field size, tissue depth and observable response before selecting a projected pixel size.
Use the chosen opsin’s action spectrum and kinetics, together with its expression pattern. Check the delivered source spectrum and available optical input. A wavelength inside the Polygon’s operating range does not establish efficient or selective activation of a probe.
Identify the microscope port, adapter, objective, relay, source and driver, dichroics and detection filters. For patch clamp, include electrode access and amplifier/DAQ signals. For imaging, include indicator spectra, camera exposure mode, acquisition software and trigger support.
Use an appropriate calibration target at the intended specimen plane to relate camera coordinates to projected features. Verify independent test patterns at the centre and edges, checking orientation, scale, focus and distortion. Keep calibration separate for each objective, relay and camera configuration; recheck after optical changes or drift.
Draw ROIs on a current reference image. Specify single-region, grouped and blank patterns; define their order, durations, intervals and repeats around the research question. Consider randomized or counterbalanced order to help separate location effects from adaptation or rundown. Save the actual masks and sequence.
Measure delivered power with a calibrated detector appropriate to the wavelength, geometry and power level. Use a suitable calibrated spatial measurement to assess uniformity and background across the working field. Record objective, source setting, active mask area and measurement method; compare irradiance and exposure when changing ROI area.
Choose a shared timing reference and verify supported signal levels, polarity and routing. Measure optical onset and offset with an appropriate photodetector against acquisition timing. Record event markers, actual pattern identity and any source or camera delays alongside the response.
Include a no-stimulation baseline, blank-mask trials and light-only controls in an appropriate non-expressing or reporter-only preparation. Add biological controls that distinguish direct activation from network-mediated responses, as appropriate to the question. Monitor preparation stability and assess illumination-related recording artefacts.
For a concrete historical pattern-generation and electrophysiology workflow, see the NeuroPG application note. Probe-specific stimulation settings and biological controls must be established for the actual preparation.
The object-space size of one DMD pixel depends on the complete objective and relay magnification. A small projected pixel is a sampling increment.
Aberrations, focus, numerical aperture, stray light and scattering determine the actual illuminated distribution. One-photon projection does not provide intrinsic optical sectioning.
Opsin distribution, activation thresholds, processes crossing the ROI and network responses determine which structures respond. Measure this separately from the projected pattern.
Planning implication: measure edge quality, background and alignment over the required depth and field. In a tissue slice, scattering and illumination outside the focal plane can broaden recruitment even when a calibration target shows sharp edges. Recheck after focus changes, stage movement or thermal drift.
For context on why optical confinement and opsin distribution both matter, see Baker et al. (2016), who investigated a different, two-photon approach. Its performance is not a Polygon specification.
05 / Configuration and equipment
The useful choice is the combination of input coupling, wavelength, field, contrast and microscope integration. Use these published differences to prepare a configuration discussion.
| Configuration | Optical input | Published wavelength support | Planning fit | Contrast information |
|---|---|---|---|---|
| Polygon1000-G | 3 mm-core liquid lightguide | 350–1000 nm | Lightguide-fed stimulation; standard or larger-field relay. | Request the value for the proposed wavelength and configuration. |
| Polygon1000-DL | SMA fibre input; laser sources | 400–1000 nm | Laser-fed illumination; circular projected field. | Request the value for the proposed wavelength and configuration. |
| Polygon1000-DI | Lightguide + SMA fibre inputs | Lightguide: 350–1000 nm; fibre: 400–1000 nm | One installation serving both input formats; verify each path. | Request the value for each input path and wavelength. |
| Polygon UHC | SMA fibre input; laser sources | 400–700 nm | Evaluate when residual background limits the experiment. | Manufacturer specifies 10,000,000:1 all-on / all-off contrast. |
Inputs and wavelength ranges: 2025 Polygon1000 brochure, p. 3 and 2025 UHC brochure, p. 2. The DI fibre input has a different lower wavelength limit from its lightguide input. The linked 2025 Polygon1000 brochure does not state a numerical contrast ratio for G, DL or DI; request the configuration-specific specification.
Mightex defines the UHC figure as the intensity ratio between all-on and all-off images. It does not establish the light level next to a small ROI inside tissue. Ask how contrast is measured at your wavelength, then measure specimen-plane background for the actual masks. UHC contrast definition.
For the brochure’s Nikon example, a standard G configuration at 20× gives a nominal 495 × 310 µm field and 0.38 µm projected pixel sampling. A larger-field relay changes both. These are geometric specifications, not demonstrated biological resolution. Confirm the objective and complete relay. Field and sampling tables, pp. 5–6.
| Component | Status in this workflow | Role and selection check |
|---|---|---|
| Polygon patterned illuminator | Required | Applies the spatial mask. Select input format, wavelength range, relay and contrast requirements. |
| Light source + source driver | Required | Provide the wavelength, optical power and gating. A source driver is separate from DMD pattern control; match coupling and permitted input levels. |
| Microscope adapter, relay + objective | Required for this application | Deliver and focus the pattern in the preparation. Match the microscope model, port geometry, field and working distance. |
| Pattern software + supported computer | Required | Create masks, calibrate coordinates and run sequences. Check the PolyScan version, licence, operating system and supported device list. |
| Reference-image camera + detection optics | Required for image-defined targeting | Acquire the image used to place ROIs and verify registration. This camera may also record the response if the complete imaging path is suitable. |
| Response recording equipment | Required | Patch-clamp/other electrophysiology or a compatible imaging chain. The Polygon does not itself measure a neuronal response. |
| Hardware timing / I/O | Required timing function; implementation varies | Use compatible existing acquisition I/O or an additional controller. PolyEcho is one manufacturer option; it is not mandatory for every installation. |
| Power measurement + calibration target | Required verification tools | Characterize delivered light, registration and drift. They can be existing laboratory equipment if suitable for the measurement. |
| Extra source, port expander or larger-field relay | Optional | Add only for a defined multi-wavelength, port-sharing or field-size requirement; assess the optical and mechanical consequences. |
Manufacturer integration and support references: microscope adapters and PolyScan hardware support. Confirm quotation scope, licences and included accessories.
Explore scientific camera candidates, filters and dichroics, and laser sources where a laser-fed Polygon is appropriate. These are components to assess for the proposed setup; catalogue presence does not establish Polygon or PolyScan compatibility.
Mightex lists native support for selected third-party cameras in PolyScan Pro. Check the exact camera, driver, licence and software version. A separate acquisition program with supported hardware triggers may be an alternative, subject to verification. Current supported hardware and licence tiers.
Ask us to assess a complete configuration06 / Recording and interpretation
The Polygon1000 brochure specifies up to 6,600 frames/s at 1-bit depth and a 50 µs input-trigger delay. Those values do not describe complete source-to-acquisition timing. Control and timing specifications, p. 6.
Distinguish preloaded pattern switching from uploading a new pattern. Include source rise/fall behaviour, trigger latency and jitter, exposure windows, acquisition buffering and event markers. Establish optical timing on the assembled setup, including the selected grayscale or sequencing mode. A software timestamp alone does not verify light at the sample.
Stimulation light may leak into the camera or excite indicator fluorescence. Imaging excitation may also activate the opsin. Review source bandwidths, probe action spectra, dichroics, emission filters and detector response together. Spectral separation and suitable blocking can reduce interference, but a clean detection filter cannot prevent imaging light from activating an opsin.
Interleaving stimulation and camera exposure can reduce direct contamination. Check detector recovery, timing overhead and the dynamics you need to measure: interleaving creates unobserved intervals and does not undo biological activation caused by imaging light. Mightex’s spectral and temporal guidance.
For a separate imaging application, Mulholland et al. (2024) reported an opto-macroscope for patterned manipulation and calcium imaging across millimetre-scale networks in developing ferret cortex. That application uses a different geometry from a culture or slice; its implementation is useful context when assessing an all-optical readout. Read the original research paper.
| Symptom | Checks |
|---|---|
| Displaced or rotated patterns | Check the correct registration file, objective/relay, camera ROI, binning, orientation, focus and stage drift. Verify independent features at the centre and edges. |
| Uneven illumination | Check source coupling, field clipping, relay alignment and source stability. Measure the working field at the specimen plane; do not infer uniformity from a saturated camera image. |
| Unwanted camera signal during stimulation | Inspect source spectra, dichroic and emission-filter blocking, internal reflections, exposure overlap and saturation/recovery. Test stimulation with no indicator-dependent signal. |
| Weak or absent responses | First verify delivered wavelength, irradiance, pattern registration and optical timing. Then assess probe expression, preparation health and the recording method with appropriate biological controls. |
| Inconsistent timing | Compare DAQ markers with measured light and camera exposure signals. Check software uploads versus stored sequences, trigger mode/polarity, source response and dropped or misidentified acquisition events. |
Practical answers
No. A drawn ROI specifies an intended illumination region. Actual recruitment depends on the measured light distribution, scattering and depth, opsin expression in somata and processes, and the preparation’s response. Validate both the optical pattern and biological selectivity.
Polygon1000-G uses a liquid lightguide; DL uses an SMA fibre input for laser sources; DI supports both input formats. Polygon UHC is a laser-fed option with a manufacturer-specified high all-on/all-off contrast. Confirm the wavelength range, coupling and relay for the specific configuration.
Only after assessing the exact spectral and timing combination. Stimulation light can contaminate detection, and imaging light can activate the opsin. Suitable filters, source spectra and interleaved acquisition may help, but they do not guarantee compatibility.
No. The published maximum applies under specified DMD operating conditions. Pattern loading, source switching, trigger latency, camera exposure and recording timing also matter. Measure optical onset and offset against acquisition on the assembled system.
From experiment to configuration
Tell us what you want to target and how you will record the response. We can help assess the optical path, source, microscope interface and timing requirements for a suitable configuration.
Sources and technical resources
Manufacturer specifications and support pages checked 15 October 2026. Polygon and PolyScan are Mightex products; their specifications are attributed to the linked Mightex documents. All guide illustrations are original conceptual drawings by Precisometer, with no experimental results reproduced. Configuration recommendations remain subject to the exact microscope, optical components, software and preparation.
Before you specify
Explore scientific-camera selection, microscopy illumination and image sampling.
 Scientific cameras
Understand quantum efficiency, read noise, pixel size, SNR, and optical sampling using real MAX and sMAX specifications.
Open guide Microscopy
How much power each imaging modality actually needs at the sample, which excitation lines match your fluorophore panel, why modulation bandwidth beats raw milliwatts, and the photon count above which laser noise finally reaches the image.
Open guide Scientific imaging
Calculate object-space pixel size, field of view, Rayleigh resolution, and sampling using real MAX and sMAX sensor formats.
Open guide