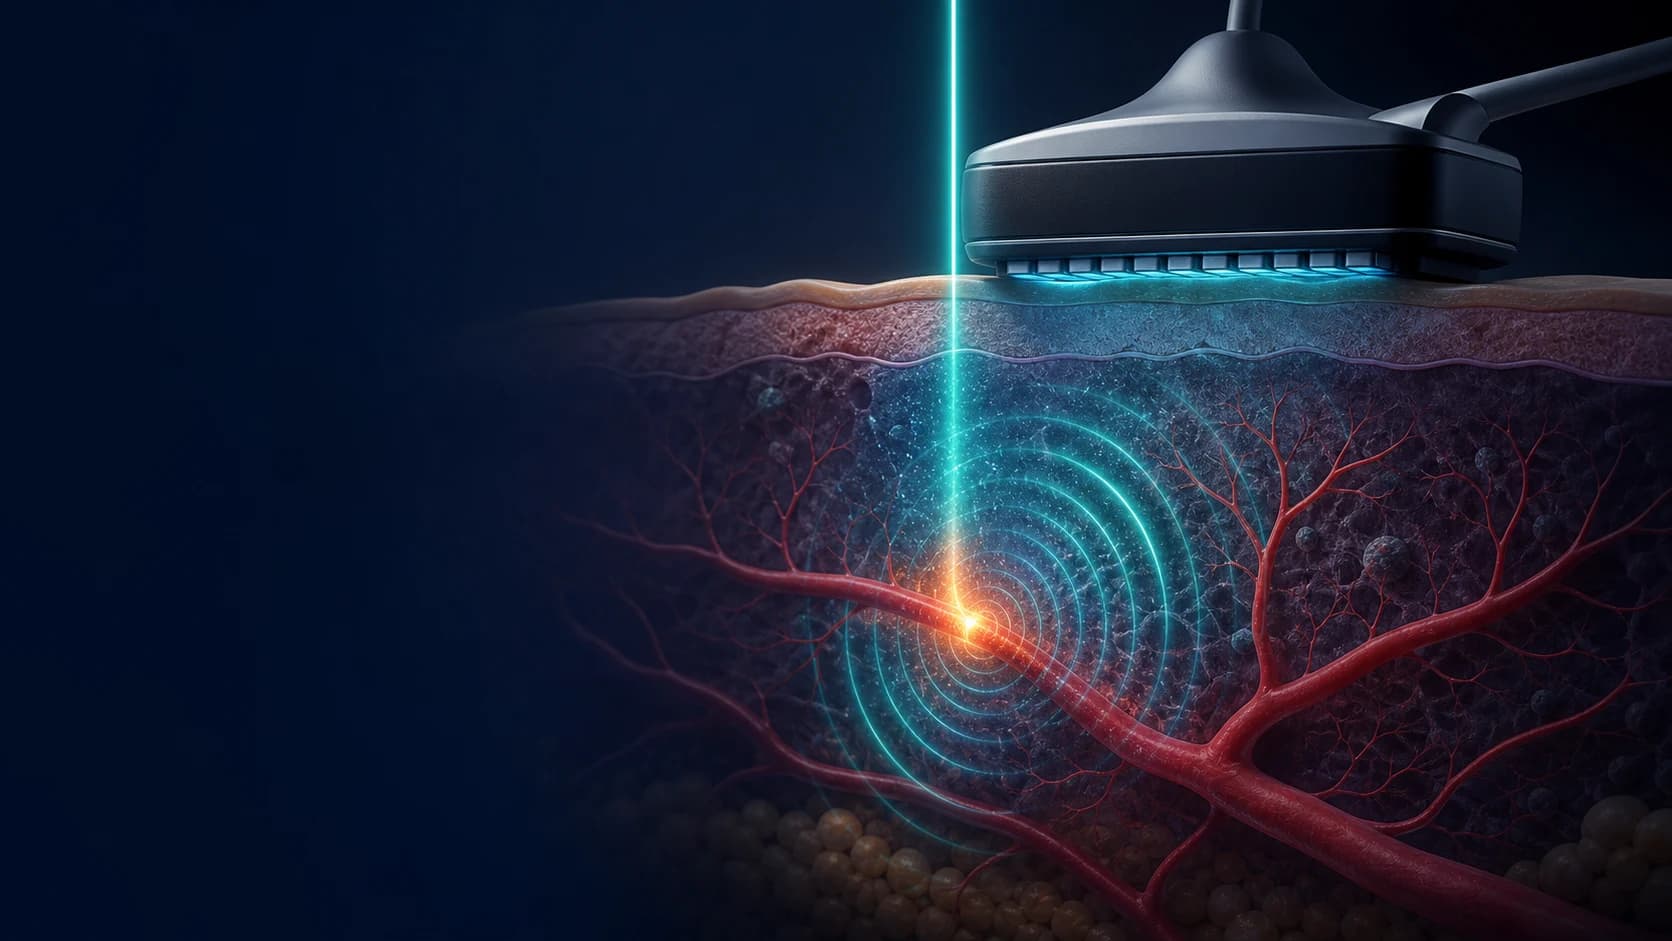
Laser application guide
Choosing a laser for photoacoustic imaging
Start with the absorber and acoustic detector. Then translate the experiment into wavelength, pulse width, fluence, repetition rate, and timing at the sample.
Signal origin
Optical absorption—not optical reflection or fluorescence.
Common excitation
Nanosecond pulses that satisfy the relevant confinement times.
Specification anchor
Pulse fluence and beam profile where the light reaches the target.
The decision in one sentence
Choose the signal you need before choosing the laser.
Photoacoustic imaging converts absorbed optical energy into an ultrasonic transient. That makes the laser one half of a coupled optical–acoustic system: wavelength and fluence create the contrast, while the detector bandwidth, aperture, coupling, and reconstruction determine which part of that pressure field becomes an image.
Name the absorber
Hemoglobin, melanin, lipid, water, nucleic acid, a dye, or a nanoparticle.
Set the geometry
Depth, field of view, spot size, scan strategy, and detector bandwidth.
Close the pulse budget
Delivered energy, fluence, repetition rate, timing, stability, and safety.
1 · Signal physics
Absorption becomes pressure in four steps.
1 · Deposit
A short optical pulse reaches an absorber. The useful input is local fluence, after every delivery loss and depth-dependent attenuation.
2 · Expand
Absorbed energy produces a small, rapid temperature rise and thermoelastic expansion.
3 · Propagate
The expanding region launches a broadband acoustic wave whose spectrum depends on absorber size and pulse duration.
4 · Reconstruct
Arrival time, detector geometry, and signal amplitude are converted into a depth-resolved image.
Idealized initial pressure
This compact relationship assumes thermal and stress confinement. A measured voltage also includes wavelength-dependent light transport, absorber geometry, acoustic attenuation, detector response, gain, and reconstruction.
Photoacoustic amplitude is not automatically a concentration measurement.
At depth, the local fluence is unknown and changes with wavelength. Quantitative chromophore or oxygenation estimates therefore need calibration or a light-transport model, energy normalization, motion control, and an unmixing method that matches the measurement.
2 · Imaging architecture
Resolution belongs to the complete instrument.
The same wavelength and pulse energy can serve very different systems. Decide which element creates the spatial focus before sizing the source.
Optical-resolution PAM
- Illumination
- Tightly focused optical spot
- Resolution driver
- Lateral resolution follows the optical focus
- Best suited to
- Superficial microvasculature and cellular-scale absorption contrast
Source consequence
Low pulse energy, high repetition rate, excellent beam quality
Acoustic-resolution PAM
- Illumination
- Diffuse or weakly focused light
- Resolution driver
- Lateral resolution follows the acoustic focus
- Best suited to
- Greater depth with mesoscopic resolution
Source consequence
More delivered pulse energy and a beam matched to the acoustic field
Photoacoustic computed tomography
- Illumination
- Wide-field or multi-sided illumination
- Resolution driver
- Array bandwidth, aperture, geometry, and reconstruction
- Best suited to
- Cross-sectional or volumetric imaging over a larger field of view
Source consequence
Uniform fluence, array synchronization, and enough energy per view
Lateral resolution
Optical focus in OR-PAM; acoustic focus, detector aperture, or reconstruction elsewhere.
Axial resolution
Primarily the detected acoustic bandwidth—not the optical depth of focus.
Useful depth
A coupled tradeoff among optical attenuation, ultrasound frequency, detector sensitivity, and required resolution.
3 · Wavelength
Wavelength defines what can create pressure.
Choose a band from the absorber spectrum and the depth-dependent fluence—not from a generic “biological window” alone. For spectroscopic imaging, each wavelength is a calibrated measurement channel.
UV · around 266 nm
Nucleic-acid-rich structures
Specialized, very shallow photoacoustic microscopy and label-free histology research.
Strong absorption and limited penetration make this a distinct architecture—not a general tissue-imaging wavelength.
Visible · 500–600 nm
Hemoglobin and melanin
Strong endogenous contrast for superficial vascular imaging and microscopy.
High absorption and optical scattering can make the fluence distribution strongly depth dependent.
Near-IR · 650–950 nm
Deeper vascular and molecular contrast
A common region for multispectral imaging where tissue attenuation is often lower than in the visible.
Spectral unmixing must account for wavelength-dependent fluence; equal incident energy does not mean equal energy at depth.
1064 nm class
Deeper illumination and source simplicity
A practical fixed wavelength with mature nanosecond laser architectures and straightforward energy scaling.
Useful penetration does not replace contrast analysis: verify the absorber spectrum and detector sensitivity first.
For multi-wavelength work: log pulse energy for every shot or wavelength, verify that the beam overlaps the same tissue volume, and characterize wavelength-dependent delivery loss. Normalizing only at the laser head leaves the most important part of the optical budget unknown.
4 · Pulse calculator
Translate the laser head into conditions at the sample.
Pulse energy becomes meaningful only after delivery efficiency and beam area are included. Change the inputs to see how quickly fluence, peak power, average power, and the stress-confinement check separate from one another.
Set the delivered pulse
Source specification lab
Illustrative starting points only; each preset changes every control.
Calculated at the sample
A 25 µm absorber gives an estimated acoustic transit time of 16.67 ns. The selected pulse is 0.42× that time.
This is an engineering calculator, not a safety limit. Permissible exposure depends on wavelength, pulse duration, beam profile, repetition pattern, tissue or sample, and the applicable laser-safety standard. Verify the actual profile and fluence independently.
Assumes a circular Gaussian beam and reports on-axis fluence from 2E/(πw²), with a 1,500 m/s sound speed. It does not model optical attenuation, beam-profile hot spots, or thermal confinement.
5 · Source architecture
Match the source to the measurement sequence.
Tunability is valuable only when the acquisition can preserve spatial registration, normalize pulse energy, and finish before the sample changes.
Optimize one contrast channel
The cleanest route when the absorber is known. It usually gives the simplest trigger chain, fastest pulse rate, and most repeatable beam delivery.
Qualify: Specify wavelength tolerance, pulse energy at the sample, stability, repetition rate, and expected duty cycle.
Switch between discrete bands
Useful when two or more established wavelengths answer the biological or materials question without continuous tuning.
Qualify: Verify switching latency, per-line energy, beam overlap, spot-size matching, and line-by-line energy monitoring.
Build a spectrum, not one image
OPO and related architectures support chromophore separation across a band, but tuning time and wavelength-dependent output become system variables.
Qualify: Record wavelength, energy, beam profile, timing, and delivery loss for every acquired spectral point.
Timing chain
One acquisition clock must govern the complete path.
Trigger
Master timing or pulse-on-demand
Laser
Optical pulse + sync output
Target
Absorption + acoustic launch
Detector
Transducer + analog front end
DAQ
Sampling + scan position + energy log
6 · Relevant products
Product starting points for photoacoustic excitation.
These catalog models span the most common fixed-wavelength regimes. They are starting points, not automatic recommendations: delivered fluence, timing, beam profile, and the acoustic detector still decide the final configuration.
High-speed visible microscopy
NS-FH-532
A high-repetition-rate 532 nm nanosecond platform for rapid vascular acquisition where optical focusing and scan speed set the architecture.
- Pulse energy
- 100 uJ
- Repetition rate
- 0.2-10 MHz
- Pulse width
- 2-10 ns @1.5 MHz
Qualify before selection
Confirm that pulse energy, detector recovery, scan speed, and sample fluence remain compatible at the intended repetition rate.
Flexible visible excitation
EO-532-N
A compact 532 nm source with a broad repetition-rate range and sub-6 ns pulses for hemoglobin-rich or other strongly absorbing visible targets.
- Pulse energy
- 100-800 uJ
- Repetition rate
- 1 Hz-25 kHz
- Pulse width
- <6 ns @<5 kHz
Qualify before selection
Size attenuation and beam expansion from the required fluence at the sample—not from the maximum available pulse energy.
Near-IR fixed-wavelength platform
EO-1064-N
A 1064 nm nanosecond source with millijoule-class pulse energy and flexible triggering for fixed-wavelength tomography or mesoscopic imaging.
- Pulse energy
- 1-1.5 mJ
- Repetition rate
- 1 Hz-25 kHz
- Pulse width
- ~7 ns
Qualify before selection
Verify absorber contrast at 1064 nm and model the wavelength-dependent fluence before treating signal amplitude as concentration.
Specialized ultraviolet excitation
DPS-266-Q
A 266 nm nanosecond source for specialized nucleic-acid-rich or strongly UV-absorbing targets where penetration is intentionally shallow.
- Pulse energy
- 2~5 mJ
- Repetition rate
- 1-100 Hz ( Adjustable )
- Pulse width
- <10 ns
Qualify before selection
This is a high-energy UV platform: attenuation, beam-profile control, exposure review, and material compatibility are central to the design.
Need tunability or several synchronized wavelengths?
Spectroscopic photoacoustics often needs a source package qualified as a system: wavelength coverage, tuning time, per-line pulse energy, beam overlap, trigger order, and shot-by-shot normalization.
7 · Specification checklist
Write the requirement at the sample plane.
Optical contrast
Absorber, wavelength band, number of wavelengths, switching time, and spectral resolution.
Delivered pulse
Energy at sample, pulse width, beam diameter, profile, hot-spot tolerance, and polarization if relevant.
Acquisition speed
A-line or frame-rate target, scan strategy, pulse repetition rate, burst mode, and duty cycle.
Stability
Pulse-to-pulse energy variation, wavelength repeatability, pointing, warm-up, and drift over the full run.
Timing
Trigger direction, latency, jitter, sync-output level, pulse-on-demand behavior, and DAQ sample clock.
Integration & safety
Delivery optics, coupling, enclosure, interlocks, monitoring, exposure review, service access, and environment.
Ready to specify
Bring the absorber, geometry, and timing diagram.
We can qualify a nanosecond source and delivery package against wavelength, pulse energy, beam size, repetition rate, energy stability, triggering, and the detector you already plan to use.
8 · Common questions
Short answers before the design review.
Does photoacoustic imaging use light or sound?+
Both. A short optical pulse deposits energy in an absorber; thermoelastic expansion launches ultrasound. The detector receives sound, while the contrast originates from optical absorption.
Why are nanosecond lasers common?+
Nanosecond pulses can deposit energy faster than the absorber mechanically relaxes, which supports efficient pressure generation under stress confinement. The useful pulse duration still depends on absorber size and the desired acoustic bandwidth.
Is the highest pulse energy the best choice?+
No. Signal can rise with absorbed fluence, but beam uniformity, sample limits, exposure rules, detector dynamic range, and nonlinear effects constrain useful energy. Specify fluence at the target rather than maximizing energy at the laser aperture.
How many wavelengths are needed for oxygenation imaging?+
At least two independent spectral measurements are needed to separate two hemoglobin species in an idealized model, but quantitative accuracy also depends on spectral coloring, calibration, motion, noise, and the unmixing model. More wavelengths can improve robustness when the system is designed for them.
Research basis and safety reference
This guide is an engineering overview, not a diagnostic, clinical, or laser-safety procedure. Useful primary examples include:
- 1. Maslov, Stoica & Wang, “In vivo dark-field reflection-mode photoacoustic microscopy,” Optics Letters 30, 625–627 (2005).
- 2. Maslov et al., “Optical-resolution photoacoustic microscopy for in vivo imaging of single capillaries,” Optics Letters 33, 929–931 (2008).
- 3. Laufer et al., “In vitro measurements of absolute blood oxygen saturation using pulsed near-infrared photoacoustic spectroscopy,” Physics in Medicine & Biology 50, 4409–4428 (2005).
- 4. ICNIRP, Guidelines on limits of exposure to laser radiation. Apply the current standard and institutional review appropriate to your system.
Continue exploring